
ELEMENTARY STATISTICS W/CONNECT >IP<
4th Edition
ISBN: 9781259746826
Author: Bluman
Publisher: MCG
expand_more
expand_more
format_list_bulleted
Videos
Textbook Question
Chapter 2.3, Problem 18E
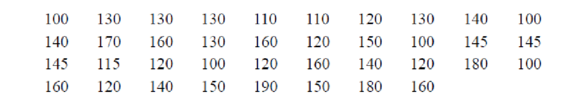
Calories in Salad Dressings A listing of calories per 1 ounce of selected salad dressings (not fat-free) is given below. Construct a stem and leaf plot for the data.
Expert Solution & Answer
Want to see the full answer?
Check out a sample textbook solution
Students have asked these similar questions
Question 2
The data below provides the battery life of thirty eight (38) motorcycle batteries.
100 83 83 105 110 81 114
99 101 105 78 115 74 96
106
89
94 81 106 91 93 86
79 103 94 108 113 100
117 120
77 93
93 85 76
89 78 88
680
a. Test the hypothesis that mean battery life is greater than 90. Use the 1% level of
significance.
b. Determine if the mean battery life is different from 80. Use the 10% level of
significance. Show all steps for the hypothesis test
c. Would your conlcusion in part (b) change at the 5% level of significance? |
d. Confirm test results in part (b) using JASP. Note: All JASP input files and output
tables should be provided
Suppose that 80% of athletes at a certain college graduate. You randomly select eight athletes. What’s the chance that at most 7 of them graduate?
Suppose that you flip a fair coin four times. What’s the chance of getting at least one head?
Chapter 2 Solutions
ELEMENTARY STATISTICS W/CONNECT >IP<
Ch. 2.1 - Ages of Presidents at Inauguration The data...Ch. 2.1 - List five reasons for organizing data into a...Ch. 2.1 - Name the three types of frequency distributions,...Ch. 2.1 - How many classes should frequency distributions...Ch. 2.1 - What are open-ended frequency distributions? Why...Ch. 2.1 - Prob. 5ECh. 2.1 - For Exercises 58, find the class boundaries,...Ch. 2.1 - Prob. 7ECh. 2.1 - For Exercises 58, find the class boundaries,...Ch. 2.1 - Prob. 9E
Ch. 2.1 - For Exercises 912, show frequency distributions...Ch. 2.1 - Prob. 11ECh. 2.1 - For Exercises 912, show frequency distributions...Ch. 2.1 - Prob. 13ECh. 2.1 - Trust in Internet Information A survey was taken...Ch. 2.1 - Eating at Fast Food Restaurants A survey was taken...Ch. 2.1 - Ages of Dogs The ages of 20 dogs in a pet shelter...Ch. 2.1 - Prob. 17ECh. 2.1 - Stories in the Worlds Tallest Buildings The number...Ch. 2.1 - Ages of Declaration of Independence Signers The...Ch. 2.1 - Salaries of Governors Here are the salaries (in...Ch. 2.1 - Charity Donations A random sample of 30 large...Ch. 2.1 - Unclaimed Expired Prizes The number of unclaimed...Ch. 2.1 - Prob. 23ECh. 2.1 - Consumption of Natural Gas Construct a frequency...Ch. 2.1 - Average Wind Speeds A sample of 40 large cities...Ch. 2.1 - Percentage of People Who Completed 4 or More Years...Ch. 2.1 - JFK Assassination A researcher conducted a survey...Ch. 2.1 - The Value of Pi The ratio of the circumference of...Ch. 2.2 - Selling Real Estate Assume you are a realtor in...Ch. 2.2 - Do Students Need Summer Development? For 108...Ch. 2.2 - Prob. 2ECh. 2.2 - Prob. 3ECh. 2.2 - Number of College Faculty The number of faculty...Ch. 2.2 - Railroad Crossing Accidents The data show the...Ch. 2.2 - NFL Salaries The salaries (in millions of dollars)...Ch. 2.2 - Prob. 7ECh. 2.2 - Costs of Utilities The frequency distribution...Ch. 2.2 - Air Pollution One of the air pollutants that is...Ch. 2.2 - Making the Grade The frequency distributions shown...Ch. 2.2 - Blood Glucose Levels The frequency distribution...Ch. 2.2 - Waiting Times The frequency distribution shows the...Ch. 2.2 - Construct a histogram, frequency polygon, and...Ch. 2.2 - Construct a histogram, frequency polygon, and...Ch. 2.2 - Construct a histogram, frequency polygon, and...Ch. 2.2 - Construct a histogram, frequency polygon, and...Ch. 2.2 - Prob. 17ECh. 2.2 - Protein Grams in Fast Food The amount of protein...Ch. 2.2 - Using the histogram shown here, do the following....Ch. 2.2 - Using the results from Exercise 19. answer these...Ch. 2.2 - Math SAT Scores Shown is an ogive depicting the...Ch. 2.3 - Applying the Concepts 23 Causes of Accidental...Ch. 2.3 - Prob. 1ECh. 2.3 - Worldwide Sales of Fast Foods The worldwide sales...Ch. 2.3 - Prob. 3ECh. 2.3 - Roller Coaster Mania The World Roller Coaster...Ch. 2.3 - Prob. 5ECh. 2.3 - Violent Crimes The number of all violent crimes...Ch. 2.3 - Prob. 7ECh. 2.3 - Valentines Day Spending The data show the average...Ch. 2.3 - Prob. 9ECh. 2.3 - Reasons We Travel The following data are based on...Ch. 2.3 - Prob. 11ECh. 2.3 - Colors of Automobiles The popular car colors are...Ch. 2.3 - Prob. 13ECh. 2.3 - Prob. 14ECh. 2.3 - Years of Experience The data show the number of...Ch. 2.3 - Commuting Times Fifty off-campus students were...Ch. 2.3 - Home Run Club There are 43 Major League baseball...Ch. 2.3 - Calories in Salad Dressings A listing of calories...Ch. 2.3 - Length of Major Rivers The data show the lengths...Ch. 2.3 - Math and Reading Achievement Scores The math and...Ch. 2.3 - State which type of graph (Pareto chart, time...Ch. 2.3 - State which graph (Pareto chart, time series...Ch. 2.3 - Prob. 23ECh. 2.3 - Prob. 24ECh. 2.3 - Cost of Milk The graph shows the increase in the...Ch. 2.3 - U.S. Population by Age The following information...Ch. 2.3 - Prob. 27ECh. 2.3 - Trip Reimbursements The average amount requested...Ch. 2 - How People Get Their News The Brunswick Research...Ch. 2 - Mens World Hockey Champions The United States won...Ch. 2 - BUN Count The blood urea nitrogen (BUN) count of...Ch. 2 - Wind Speed The data show the average wind speed...Ch. 2 - Prob. 2.1.5RECh. 2 - Ages of the Vice Presidents at the Time of Their...Ch. 2 - Prob. 2.2.7RECh. 2 - Find the relative frequency for the frequency...Ch. 2 - Construct a histogram, frequency polygon, and...Ch. 2 - Construct a histogram, frequency polygon, and...Ch. 2 - Construct a histogram, frequency polygon, and...Ch. 2 - Construct a histogram, frequency polygon, and...Ch. 2 - Prob. 2.3.13RECh. 2 - Calories of Nuts The data show the number of...Ch. 2 - Prob. 2.3.15RECh. 2 - AID: 1825 | 31/5/2018 16. Pet Care The data (in...Ch. 2 - Prob. 2.3.17RECh. 2 - Prob. 2.3.18RECh. 2 - Prob. 2.3.19RECh. 2 - Prob. 2.3.20RECh. 2 - Prob. 2.3.21RECh. 2 - Prob. 2.3.22RECh. 2 - Prob. 2.3.23RECh. 2 - Public Libraries The numbers of public libraries...Ch. 2 - Pain Relief The graph below shows the time it...Ch. 2 - Casino Payoffs The graph shows the payoffs...Ch. 2 - From the Data Bank located in Appendix B, choose...Ch. 2 - Prob. 2DACh. 2 - From the Data Bank, select at least 30 subjects...Ch. 2 - Prob. 4DACh. 2 - Using the data from Data Set XI in Appendix B,...Ch. 2 - Prob. 7DACh. 2 - Determine whether each statement is true or false....Ch. 2 - Prob. 2CQCh. 2 - Prob. 3CQCh. 2 - Frequency distributions can aid the researcher in...Ch. 2 - Determine whether each statement is true or false....Ch. 2 - Prob. 6CQCh. 2 - Determine whether each statement is true or false....Ch. 2 - Prob. 8CQCh. 2 - What are the boundaries for 8.68.8? a. 89 b....Ch. 2 - What graph should be used to show the relationship...Ch. 2 - Prob. 11CQCh. 2 - The three types of frequency distributions are...Ch. 2 - In a frequency distribution, the number of classes...Ch. 2 - Prob. 14CQCh. 2 - Data collected over a period of time can be...Ch. 2 - A statistical device used in exploratory data...Ch. 2 - On a Pareto chart, the frequencies should be...Ch. 2 - Housing Arrangements A questionnaire on housing...Ch. 2 - Housing Arrangements A questionnaire on housing...Ch. 2 - Prob. 20CQCh. 2 - Construct a histogram, a frequency polygon, and an...Ch. 2 - Coal Consumption The following data represent the...Ch. 2 - Construct a histogram, frequency polygon, and...Ch. 2 - Recycled Trash Construct a Pareto chart and a...Ch. 2 - Identity Thefts The results of a survey of 84...Ch. 2 - Needless Deaths of Children The New England...Ch. 2 - Prob. 27CQCh. 2 - Parking Meter Revenue In a small city the number...Ch. 2 - Prob. 29CQCh. 2 - The Great Lakes Shown are various statistics about...Ch. 2 - Teacher Strikes In Pennsylvania there were more...
Knowledge Booster


Learn more about
Need a deep-dive on the concept behind this application? Look no further. Learn more about this topic, statistics and related others by exploring similar questions and additional content below.Similar questions
- Suppose that the chance that an elementary student eats hot lunch is 30 percent. What’s the chance that, among 20 randomly selected students, between 6 and 8 students eat hot lunch (inclusive)?arrow_forwardBob’s commuting times to work are varied. He makes it to work on time 80 percent of the time. On 12 randomly selected trips to work, what’s the chance that Bob makes it on time at least 10 times?arrow_forwardYour chance of winning a small prize in a scratch-off ticket is 10 percent. You buy five tickets. What’s the chance you will win at least one prize?arrow_forward
- Suppose that 60 percent of families own a pet. You randomly sample four families. What is the chance that two or three of them own a pet?arrow_forwardIf 40 percent of university students purchase their textbooks online, in a random sample of five students, what’s the chance that exactly one of them purchased their textbooks online?arrow_forwardA stoplight is green 40 percent of the time. If you stop at this light eight random times, what is the chance that it’s green exactly five times?arrow_forward
- If 10 percent of the parts made by a certain company are defective and have to be remade, what is the chance that a random sample of four parts has one that is defective?arrow_forwardQuestion 4 Fourteen individuals were given a complex puzzle to complete. The times in seconds was recorded for their first and second attempts and the results provided below: 1 2 3 first attempt 172 255 second attempt 70 4 5 114 248 218 194 270 267 66 6 7 230 219 341 174 8 10 9 210 261 347 218 200 281 199 308 268 243 236 300 11 12 13 14 140 302 a. Calculate a 95% confidence interval for the mean time taken by each individual to complete the (i) first attempt and (ii) second attempt. [la] b. Test the hypothesis that the difference between the two mean times for both is 100 seconds. Use the 5% level of significance. c. Subsequently, it was learnt that the times for the second attempt were incorrecly recorded and that each of the values is 50 seconds too large. What, if any, difference does this make to the results of the test done in part (b)? Show all steps for the hypothesis testarrow_forwardQuestion 3 3200 students were asked about the importance of study groups in successfully completing their courses. They were asked to provide their current majors as well as their opinion. The results are given below: Major Opinion Psychology Sociology Economics Statistics Accounting Total Agree 144 183 201 271 251 1050 Disagree 230 233 254 227 218 1162 Impartial 201 181 196 234 176 988 Total 575 597 651 732 645 3200 a. State both the null and alternative hypotheses. b. Provide the decision rule for making this decision. Use an alpha level of 5%. c. Show all of the work necessary to calculate the appropriate statistic. | d. What conclusion are you allowed to draw? c. Would your conclusion change at the 10% level of significance? f. Confirm test results in part (c) using JASP. Note: All JASP input files and output tables should be providedarrow_forward
- Question 1 A tech company has acknowledged the importance of having records of all meetings conducted. The meetings are very fast paced and requires equipment that is able to capture the information in the shortest possible time. There are two options, using a typewriter or a word processor. Fifteen administrative assistants are selected and the amount of typing time in hours was recorded. The results are given below: 1 2 3 4 5 6 7 8 9 10 11 12 13 14 15 typewriter 8.0 6.5 5.0 6.7 7.8 8.5 7.2 5.7 9.2 5.7 6.5 word processor 7.2 5.7 8.3 7.5 9.2 7.2 6.5 7.0 6.9 34 7.0 6.9 8.8 6.7 8.8 9.4 8.6 5.5 7.2 8.4 a. Test the hypothesis that the mean typing time in hours for typewriters is less than 7.0. Use the 1% level of significance. b. Construct a 90% confidence interval for the difference in mean typing time in hours, where a difference is equal to the typing time in hours of word processors minus typing time in hours of typewriter. c. Using the 5% significance level, determine whether there is…arrow_forwardIllustrate 2/7×4/5 using a rectangular region. Explain your work. arrow_forwardWrite three other different proportions equivalent to the following using the same values as in the given proportion 3 foot over 1 yard equals X feet over 5 yardsarrow_forward
arrow_back_ios
SEE MORE QUESTIONS
arrow_forward_ios
Recommended textbooks for you
 Glencoe Algebra 1, Student Edition, 9780079039897...AlgebraISBN:9780079039897Author:CarterPublisher:McGraw Hill
 Holt Mcdougal Larson Pre-algebra: Student Edition...AlgebraISBN:9780547587776Author:HOLT MCDOUGALPublisher:HOLT MCDOUGAL
 Big Ideas Math A Bridge To Success Algebra 1: Stu...AlgebraISBN:9781680331141Author:HOUGHTON MIFFLIN HARCOURTPublisher:Houghton Mifflin Harcourt
 College Algebra (MindTap Course List)AlgebraISBN:9781305652231Author:R. David Gustafson, Jeff HughesPublisher:Cengage Learning
Glencoe Algebra 1, Student Edition, 9780079039897...
Algebra
ISBN:9780079039897
Author:Carter
Publisher:McGraw Hill
Holt Mcdougal Larson Pre-algebra: Student Edition...
Algebra
ISBN:9780547587776
Author:HOLT MCDOUGAL
Publisher:HOLT MCDOUGAL
Big Ideas Math A Bridge To Success Algebra 1: Stu...
Algebra
ISBN:9781680331141
Author:HOUGHTON MIFFLIN HARCOURT
Publisher:Houghton Mifflin Harcourt
College Algebra (MindTap Course List)
Algebra
ISBN:9781305652231
Author:R. David Gustafson, Jeff Hughes
Publisher:Cengage Learning
Hypothesis Testing using Confidence Interval Approach; Author: BUM2413 Applied Statistics UMP;https://www.youtube.com/watch?v=Hq1l3e9pLyY;License: Standard YouTube License, CC-BY
Hypothesis Testing - Difference of Two Means - Student's -Distribution & Normal Distribution; Author: The Organic Chemistry Tutor;https://www.youtube.com/watch?v=UcZwyzwWU7o;License: Standard Youtube License