
Concept explainers
Videos
Data from a 20-yr study show the number of new AIDS cases diagnosed among 20- to 24-yr-olds in the United States x years after the study began.
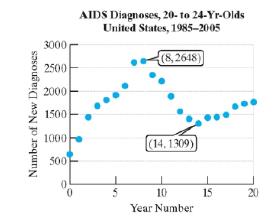
a. Approximate the interval(s) over which the number of new AIDS cases among 20- to 24-yr-olds increased.
b. Approximate the interval(s) over which the number of new AIDS cases among 20- to 24-yr-olds decreased.
c. How many turning points does the graph show?
d. Based on the number of turning points, what is the minimum degree of a polynomial function that could be used to model the data? Would the leading coefficient be positive or negative?
e. How many years after the study began was the number of new AIDS cases among 20- to 24-yr-olds the greatest?
f. What was the maximum number of new cases diagnosed in a single year?

Trending nowThis is a popular solution!

Chapter 2 Solutions
PreCalculus-Aleks 360 Access
Additional Math Textbook Solutions
Basic Business Statistics, Student Value Edition
A First Course in Probability (10th Edition)
Elementary Statistics (13th Edition)
Pre-Algebra Student Edition
Introductory Statistics
College Algebra with Modeling & Visualization (5th Edition)


- Ministry of Higher Education & Scientific Research Babylon University College of Engineering- Al musayab Subject :Numerical Analysis Stage:Third Time: 2 hour Automobile Department Date:26-3-2023 nd 1st month exam/2" semester (2022-2023) Note: Answer all questions, all questions have same degree. Q1: Use Newton's method to find solutions to the system with two step Take (X,Yo)=(8,10). { x35x2 + 2xy + 13 = 0 x3 + x²-14x-y-19=0 Q2/:Solve the system by Gauss-Seidel iterative method.(Perform only three iterations). 8x-3y+2z-20 4x+11y-z-33 6x+3y+12z-35 03/:Curve fit the data using a power function X 2 4 8 5 6 0.7500 0.1875 0.1200 0.0833 0.0469arrow_forwardUniversity of Babylon Faculty of Engineering-AlMusyab Automobile Eng. Dep. Year: 2022-2023, 2nd Course, 1 Attempt Stage: Third Subject: Numerical Analysis Date: 2023\\ Time: 3 Hour dy = x + yl Q5-A: Using Euler's method, find an approximate value of (y) corresponding to (x=0.3),given that[- and [y=1 when x=0].(taking h=0.1). dx (10 M) Q5-B Find a root of an equation[f(x)=x-x-1] using Newton Raphson method to an accuracy of &=0. (10 M) Q6:Using Newton's divided differences formula, evaluate f(8) given: X 4 58 7 103 11 13 Y=f(x) 48 100 900 294 1210 2028 (20 M) Lexaminer: Examiner: Good luck W Head of Department:arrow_forwardExplain the conditions under which the Radius of Convergence of the Power Series is a "finite positive real number" r>0arrow_forward
- This means that when the Radius of Convergence of the Power Series is a "finite positive real number" r>0, then every point x of the Power Series on (-r, r) will absolutely converge (x ∈ (-r, r)). Moreover, every point x on the Power Series (-∞, -r)U(r, +∞) will diverge (|x| >r). Please explain it.arrow_forwardExplain the conditions under which Radious of Convergence of Power Series is infinite. Explain what will happen?arrow_forwardExplain the conditions under Radius of Convergence which of Power Series is 0arrow_forward
- Explain the key points and reasons for 12.8.2 (1) and 12.8.2 (2)arrow_forwardQ1: A slider in a machine moves along a fixed straight rod. Its distance x cm along the rod is given below for various values of the time. Find the velocity and acceleration of the slider when t = 0.3 seconds. t(seconds) x(cm) 0 0.1 0.2 0.3 0.4 0.5 0.6 30.13 31.62 32.87 33.64 33.95 33.81 33.24 Q2: Using the Runge-Kutta method of fourth order, solve for y atr = 1.2, From dy_2xy +et = dx x²+xc* Take h=0.2. given x = 1, y = 0 Q3:Approximate the solution of the following equation using finite difference method. ly -(1-y= y = x), y(1) = 2 and y(3) = −1 On the interval (1≤x≤3).(taking h=0.5).arrow_forwardConsider the function f(x) = x²-1. (a) Find the instantaneous rate of change of f(x) at x=1 using the definition of the derivative. Show all your steps clearly. (b) Sketch the graph of f(x) around x = 1. Draw the secant line passing through the points on the graph where x 1 and x-> 1+h (for a small positive value of h, illustrate conceptually). Then, draw the tangent line to the graph at x=1. Explain how the slope of the tangent line relates to the value you found in part (a). (c) In a few sentences, explain what the instantaneous rate of change of f(x) at x = 1 represents in the context of the graph of f(x). How does the rate of change of this function vary at different points?arrow_forward
- 1. The graph of ƒ is given. Use the graph to evaluate each of the following values. If a value does not exist, state that fact. и (a) f'(-5) (b) f'(-3) (c) f'(0) (d) f'(5) 2. Find an equation of the tangent line to the graph of y = g(x) at x = 5 if g(5) = −3 and g'(5) = 4. - 3. If an equation of the tangent line to the graph of y = f(x) at the point where x 2 is y = 4x — 5, find ƒ(2) and f'(2).arrow_forwardDoes the series converge or divergearrow_forwardDoes the series converge or divergearrow_forward
 Glencoe Algebra 1, Student Edition, 9780079039897...AlgebraISBN:9780079039897Author:CarterPublisher:McGraw Hill
 College Algebra (MindTap Course List)AlgebraISBN:9781305652231Author:R. David Gustafson, Jeff HughesPublisher:Cengage Learning
 Holt Mcdougal Larson Pre-algebra: Student Edition...AlgebraISBN:9780547587776Author:HOLT MCDOUGALPublisher:HOLT MCDOUGAL
 Big Ideas Math A Bridge To Success Algebra 1: Stu...AlgebraISBN:9781680331141Author:HOUGHTON MIFFLIN HARCOURTPublisher:Houghton Mifflin Harcourt