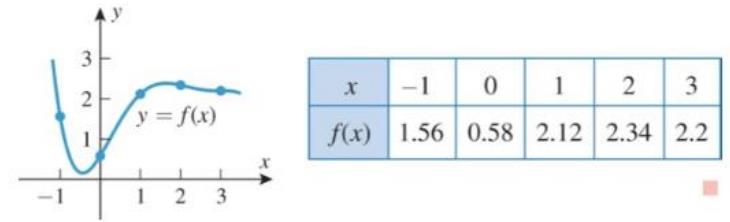
The function f whose graph is shown below has values as given in the accompanying table. (a) Use data from the table to calculate the difference quotients f 3 − f 1 3 − 1 , f 2 − f 1 2 − 1 , f 2 − f 0 2 − 0 (b) Using the graph of y = f x , indicate which difference quotient in part (a) best approximates f ′ 1 and which difference quotient gives the worst approximation to f ′ 1 .
The function f whose graph is shown below has values as given in the accompanying table. (a) Use data from the table to calculate the difference quotients f 3 − f 1 3 − 1 , f 2 − f 1 2 − 1 , f 2 − f 0 2 − 0 (b) Using the graph of y = f x , indicate which difference quotient in part (a) best approximates f ′ 1 and which difference quotient gives the worst approximation to f ′ 1 .
The function
f
whose graph is shown below has values as given in the accompanying table.
(a) Use data from the table to calculate the difference quotients
f
3
−
f
1
3
−
1
,
f
2
−
f
1
2
−
1
,
f
2
−
f
0
2
−
0
(b) Using the graph of
y
=
f
x
, indicate which difference quotient in part (a) best approximates
f
′
1
and which difference quotient gives the worst approximation to
f
′
1
.
Good Day,
Please assist with the following.
Regards,
For each given function f(x) find f'(x) using the rules learned in section 9.5.
1. f(x)=x32
32x
2. f(x)=7x+13
3. f(x) =
x4
4. f(x) = √√x³
5. f(x) = 3x²+
3
x2
Find:
lim x →-6 f (x)
limx-4 f (x)
lim x-1 f (x)
lim x →4 f (x)
(-6,3) •
(-1,5)
-8
-7
(-6,-2)
4+
(4,5)
(4,2) •
(-1,1)
-6
Need a deep-dive on the concept behind this application? Look no further. Learn more about this topic, calculus and related others by exploring similar questions and additional content below.


 Algebra & Trigonometry with Analytic GeometryAlgebraISBN:9781133382119Author:SwokowskiPublisher:Cengage
 College AlgebraAlgebraISBN:9781305115545Author:James Stewart, Lothar Redlin, Saleem WatsonPublisher:Cengage Learning
 Algebra and Trigonometry (MindTap Course List)AlgebraISBN:9781305071742Author:James Stewart, Lothar Redlin, Saleem WatsonPublisher:Cengage Learning
 Algebra: Structure And Method, Book 1AlgebraISBN:9780395977224Author:Richard G. Brown, Mary P. Dolciani, Robert H. Sorgenfrey, William L. ColePublisher:McDougal Littell