
Concept explainers
Videos
Batting average: The following frequency distribution presents the batting averages of Major League Baseball players in both the American League and the National League who had 300 or more plate appearances during a recent season.
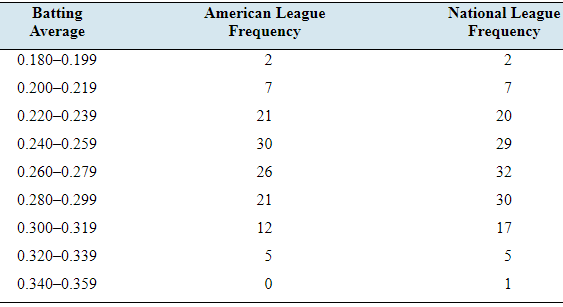
- Construct a frequency histogram for the American League.
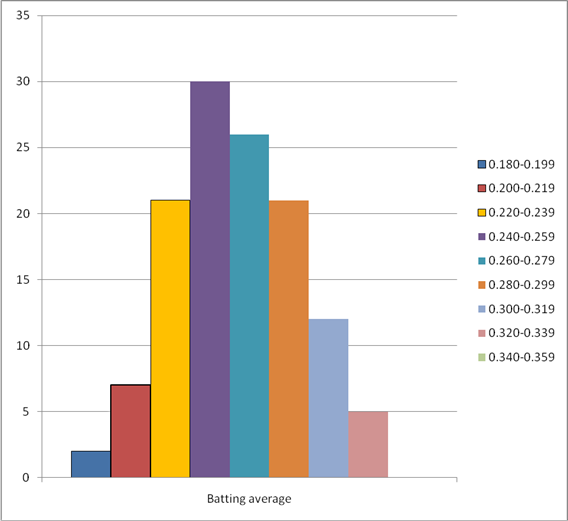
- Construct a frequency histogram for the National League.
- Construct a relative frequency distribution for the American League.
- Construct a relative frequency distribution for the National League.
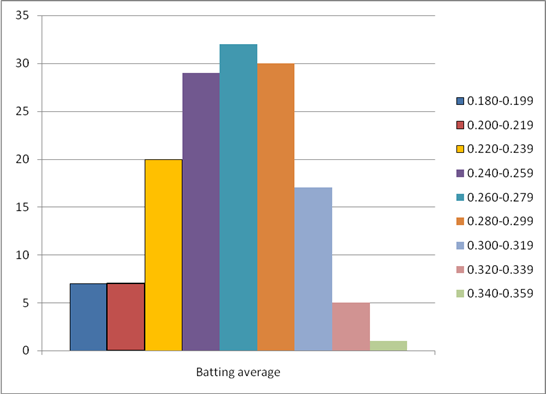
- Construct a relative frequency histogram for the American League.
- Construct a relative frequency histogram for the National League.
- What percentage of American League players had batting averages of 0.300 or more?
- What percentage of National League players had batting averages of 0.300 or more?
- Compare the relative frequency histograms. What is the main difference between the distributions of batting averages in the two leagues?
a.
To construct: A frequency histogram for American League.
Explanation of Solution
Given information:The following frequency distribution presents the batting averages of Major League Baseball players in both the American League and the National League who had 300 or more plate appearances during a recent season.
| Batting average | American LeagueFrequency | National LeagueFrequency |
| 0.180-0.199 | 2 | 2 |
| 0.200-0.219 | 7 | 7 |
| 0.220-0.239 | 21 | 20 |
| 0.240-0.259 | 30 | 29 |
| 0.260-0.279 | 26 | 32 |
| 0.280-0.299 | 21 | 30 |
| 0.300-0.319 | 12 | 17 |
| 0.320-0.339 | 5 | 5 |
| 0.340-0.359 | 0 | 1 |
Definition used: Histograms based on frequency distributions are called frequency histogram.
Solution:
The following frequency distribution presents the batting averages of Major League Baseball players in the American Leaguewho had 300 or more plate appearances during a recent season.
| Batting average | American LeagueFrequency |
| 0.180-0.199 | 2 |
| 0.200-0.219 | 7 |
| 0.220-0.239 | 21 |
| 0.240-0.259 | 30 |
| 0.260-0.279 | 26 |
| 0.280-0.299 | 21 |
| 0.300-0.319 | 12 |
| 0.320-0.339 | 5 |
| 0.340-0.359 | 0 |
The frequency histogram for American League is given by
b.
To construct: A frequency histogram for National League.
Explanation of Solution
Given information:The following frequency distribution presents the batting averages of Major League Baseball players in both the American League and the National League who had 300 or more plate appearances during a recent season.
| Batting average | American LeagueFrequency | National LeagueFrequency |
| 0.180-0.199 | 2 | 2 |
| 0.200-0.219 | 7 | 7 |
| 0.220-0.239 | 21 | 20 |
| 0.240-0.259 | 30 | 29 |
| 0.260-0.279 | 26 | 32 |
| 0.280-0.299 | 21 | 30 |
| 0.300-0.319 | 12 | 17 |
| 0.320-0.339 | 5 | 5 |
| 0.340-0.359 | 0 | 1 |
Definition used: Histograms based on frequency distributions are called frequency histogram.
Solution:
The following frequency distribution presents the batting averages of Major League Baseball players in the American Leaguewho had 300 or more plate appearances during a recent season.
| Batting average | National LeagueFrequency |
| 0.180-0.199 | 2 |
| 0.200-0.219 | 7 |
| 0.220-0.239 | 20 |
| 0.240-0.259 | 29 |
| 0.260-0.279 | 32 |
| 0.280-0.299 | 30 |
| 0.300-0.319 | 17 |
| 0.320-0.339 | 5 |
| 0.340-0.359 | 1 |
The frequency histogram for American League is given by
c.
To construct: A relative frequency distribution for American League.
Explanation of Solution
Given information:The following frequency distribution presents the batting averages of Major League Baseball players in both the American League and the National League who had 300 or more plate appearances during a recent season.
| Batting average | American LeagueFrequency | National LeagueFrequency |
| 0.180-0.199 | 2 | 2 |
| 0.200-0.219 | 7 | 7 |
| 0.220-0.239 | 21 | 20 |
| 0.240-0.259 | 30 | 29 |
| 0.260-0.279 | 26 | 32 |
| 0.280-0.299 | 21 | 30 |
| 0.300-0.319 | 12 | 17 |
| 0.320-0.339 | 5 | 5 |
| 0.340-0.359 | 0 | 1 |
Formula used:
Solution:
From the given table,
The sum of all frequency for American League is
The table of relative frequency is given by
| Batting average | American LeagueFrequency | American LeagueRelative frequency |
| 0.180-0.199 | 2 | |
| 0.200-0.219 | 7 | |
| 0.220-0.239 | 21 | |
| 0.240-0.259 | 30 | |
| 0.260-0.279 | 26 | |
| 0.280-0.299 | 21 | |
| 0.300-0.319 | 12 | |
| 0.320-0.339 | 5 | |
| 0.340-0.359 | 0 |
The relative frequency for the American League is given by
| Batting average | American LeagueRelative frequency |
| 0.180-0.199 | 0.016 |
| 0.200-0.219 | 0.056 |
| 0.220-0.239 | 0.169 |
| 0.240-0.259 | 0.242 |
| 0.260-0.279 | 0.210 |
| 0.280-0.299 | 0.169 |
| 0.300-0.319 | 0.097 |
| 0.320-0.339 | 0.040 |
| 0.340-0.359 | 0.000 |
d.
To construct: A relative frequency distribution for National League.
Explanation of Solution
Given information:The following frequency distribution presents the batting averages of Major League Baseball players in both the American League and the National League who had 300 or more plate appearances during a recent season.
| Batting average | American LeagueFrequency | National LeagueFrequency |
| 0.180-0.199 | 2 | 2 |
| 0.200-0.219 | 7 | 7 |
| 0.220-0.239 | 21 | 20 |
| 0.240-0.259 | 30 | 29 |
| 0.260-0.279 | 26 | 32 |
| 0.280-0.299 | 21 | 30 |
| 0.300-0.319 | 12 | 17 |
| 0.320-0.339 | 5 | 5 |
| 0.340-0.359 | 0 | 1 |
Formula used:
Solution:
From the given table,
The sum of all frequency for National League is
The table of relative frequency is given by
| Batting average | National LeagueFrequency | National LeagueRelative frequency |
| 0.180-0.199 | 2 | |
| 0.200-0.219 | 7 | |
| 0.220-0.239 | 20 | |
| 0.240-0.259 | 29 | |
| 0.260-0.279 | 32 | |
| 0.280-0.299 | 30 | |
| 0.300-0.319 | 17 | |
| 0.320-0.339 | 5 | |
| 0.340-0.359 | 1 |
The relative frequency for the NationalLeague is given by
| Batting average | National LeagueRelative frequency |
| 0.180-0.199 | 0.014 |
| 0.200-0.219 | 0.049 |
| 0.220-0.239 | 0.140 |
| 0.240-0.259 | 0.203 |
| 0.260-0.279 | 0.224 |
| 0.280-0.299 | 0.210 |
| 0.300-0.319 | 0.119 |
| 0.320-0.339 | 0.035 |
| 0.340-0.359 | 0.007 |
e.
To construct: A relative frequency histogram for American League.
Explanation of Solution
Given information:The following frequency distribution presents the batting averages of Major League Baseball players in both the American League and the National League who had 300 or more plate appearances during a recent season.
| Batting average | American LeagueFrequency | National LeagueFrequency |
| 0.180-0.199 | 2 | 2 |
| 0.200-0.219 | 7 | 7 |
| 0.220-0.239 | 21 | 20 |
| 0.240-0.259 | 30 | 29 |
| 0.260-0.279 | 26 | 32 |
| 0.280-0.299 | 21 | 30 |
| 0.300-0.319 | 12 | 17 |
| 0.320-0.339 | 5 | 5 |
| 0.340-0.359 | 0 | 1 |
Definition used: Histograms based on relative frequency distributions are called relative frequency histogram.
Solution:
| Batting average | American LeagueRelative frequency |
| 0.180-0.199 | 0.016 |
| 0.200-0.219 | 0.056 |
| 0.220-0.239 | 0.169 |
| 0.240-0.259 | 0.242 |
| 0.260-0.279 | 0.210 |
| 0.280-0.299 | 0.169 |
| 0.300-0.319 | 0.097 |
| 0.320-0.339 | 0.040 |
| 0.340-0.359 | 0.000 |
The relative frequency histogram for the given data is given by

f.
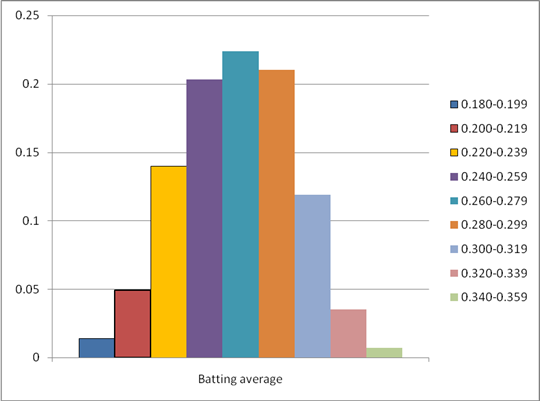
To construct: A relative frequency histogram for National League.
Explanation of Solution
Given information:The following frequency distribution presents the batting averages of Major League Baseball players in both the American League and the National League who had 300 or more plate appearances during a recent season.
| Batting average | American LeagueFrequency | National LeagueFrequency |
| 0.180-0.199 | 2 | 2 |
| 0.200-0.219 | 7 | 7 |
| 0.220-0.239 | 21 | 20 |
| 0.240-0.259 | 30 | 29 |
| 0.260-0.279 | 26 | 32 |
| 0.280-0.299 | 21 | 30 |
| 0.300-0.319 | 12 | 17 |
| 0.320-0.339 | 5 | 5 |
| 0.340-0.359 | 0 | 1 |
Definition used: Histograms based on relative frequency distributions are called relative frequency histogram.
Solution:
| Batting average | NationalLeagueRelative frequency |
| 0.180-0.199 | 0.014 |
| 0.200-0.219 | 0.049 |
| 0.220-0.239 | 0.140 |
| 0.240-0.259 | 0.203 |
| 0.260-0.279 | 0.224 |
| 0.280-0.299 | 0.210 |
| 0.300-0.319 | 0.119 |
| 0.320-0.339 | 0.035 |
| 0.340-0.359 | 0.007 |
The relative frequency histogram for the given data is given by

g.
To find: The percentage of American League players who had batting averages of 0.300 or more.
Answer to Problem 28E
The percentage of American League players who had batting averages of 0.300 or more is 13.7%.
Explanation of Solution
Given information:The following frequency distribution presents the batting averages of Major League Baseball players in both the American League and the National League who had 300 or more plate appearances during a recent season.
| Batting average | American LeagueFrequency | National LeagueFrequency |
| 0.180-0.199 | 2 | 2 |
| 0.200-0.219 | 7 | 7 |
| 0.220-0.239 | 21 | 20 |
| 0.240-0.259 | 30 | 29 |
| 0.260-0.279 | 26 | 32 |
| 0.280-0.299 | 21 | 30 |
| 0.300-0.319 | 12 | 17 |
| 0.320-0.339 | 5 | 5 |
| 0.340-0.359 | 0 | 1 |
Calculation:
The relative frequency for American League is given by
| Batting average | American LeagueRelative frequency |
| 0.180-0.199 | 0.016 |
| 0.200-0.219 | 0.056 |
| 0.220-0.239 | 0.169 |
| 0.240-0.259 | 0.242 |
| 0.260-0.279 | 0.210 |
| 0.280-0.299 | 0.169 |
| 0.300-0.319 | 0.097 |
| 0.320-0.339 | 0.040 |
| 0.340-0.359 | 0.000 |
From the above data, the relative frequencies of batting averages of 0.300 or more are 0.097, 0.040 and 0.000
The sum of all the above relative frequencies is
Then, its percentage is 13.7%
Hence, the percentage of American League players who had batting averages of 0.300 or more is 13.7%.
h.
To find: The percentage of National League players who had batting averages of 0.300 or more.
Answer to Problem 28E
The percentage of National League players who had batting averages of 0.300 or more is 16.1%.
Explanation of Solution
Given information:The following frequency distribution presents the batting averages of Major League Baseball players in both the American League and the National League who had 300 or more plate appearances during a recent season.
| Batting average | American LeagueFrequency | National LeagueFrequency |
| 0.180-0.199 | 2 | 2 |
| 0.200-0.219 | 7 | 7 |
| 0.220-0.239 | 21 | 20 |
| 0.240-0.259 | 30 | 29 |
| 0.260-0.279 | 26 | 32 |
| 0.280-0.299 | 21 | 30 |
| 0.300-0.319 | 12 | 17 |
| 0.320-0.339 | 5 | 5 |
| 0.340-0.359 | 0 | 1 |
Calculation:
The relative frequency for National League is given by
| Batting average | NationalLeagueRelative frequency |
| 0.180-0.199 | 0.014 |
| 0.200-0.219 | 0.049 |
| 0.220-0.239 | 0.140 |
| 0.240-0.259 | 0.203 |
| 0.260-0.279 | 0.224 |
| 0.280-0.299 | 0.210 |
| 0.300-0.319 | 0.119 |
| 0.320-0.339 | 0.035 |
| 0.340-0.359 | 0.007 |
From the above data, the relative frequencies of batting averages of 0.300 or more are 0.119, 0.035 and 0.007.
The sum of all the above relative frequencies is
Then, its percentage is 16.1%
Hence, the percentage of National League players who had batting averages of 0.300 or more is 16.1%.
i.
To find: The percentage of players who had batting averages less than 0.220.
Answer to Problem 28E
The batting averages tend to be a bit higher in the National League.
Explanation of Solution
Given information:The following frequency distribution presents the batting averages of Major League Baseball players in both the American League and the National League who had 300 or more plate appearances during a recent season.
| Batting average | American LeagueFrequency | National LeagueFrequency |
| 0.180-0.199 | 2 | 7 |
| 0.200-0.219 | 7 | 7 |
| 0.220-0.239 | 21 | 20 |
| 0.240-0.259 | 30 | 29 |
| 0.260-0.279 | 26 | 32 |
| 0.280-0.299 | 21 | 30 |
| 0.300-0.319 | 12 | 17 |
| 0.320-0.339 | 5 | 5 |
| 0.340-0.359 | 0 | 1 |
Solution:
The relative frequency histogram for American League is given by
The relative frequency histogram for the National League is given by
From the above two histograms, we can see that the relative frequency for National league is bit higher than the National League.
Hence, the batting averages tend to be a bit higher in the National League.
Want to see more full solutions like this?
Chapter 2 Solutions
ELEMENTARY STATISTICS W/CONNECT >C<
Additional Math Textbook Solutions
Precalculus: A Unit Circle Approach (3rd Edition)
College Algebra (Collegiate Math)
Intermediate Algebra (13th Edition)
Introductory Statistics
Basic College Mathematics


- Question 2 The data below provides the battery life of thirty eight (38) motorcycle batteries. 100 83 83 105 110 81 114 99 101 105 78 115 74 96 106 89 94 81 106 91 93 86 79 103 94 108 113 100 117 120 77 93 93 85 76 89 78 88 680 a. Test the hypothesis that mean battery life is greater than 90. Use the 1% level of significance. b. Determine if the mean battery life is different from 80. Use the 10% level of significance. Show all steps for the hypothesis test c. Would your conlcusion in part (b) change at the 5% level of significance? | d. Confirm test results in part (b) using JASP. Note: All JASP input files and output tables should be providedarrow_forwardSuppose that 80% of athletes at a certain college graduate. You randomly select eight athletes. What’s the chance that at most 7 of them graduate?arrow_forwardSuppose that you flip a fair coin four times. What’s the chance of getting at least one head?arrow_forward
- Suppose that the chance that an elementary student eats hot lunch is 30 percent. What’s the chance that, among 20 randomly selected students, between 6 and 8 students eat hot lunch (inclusive)?arrow_forwardBob’s commuting times to work are varied. He makes it to work on time 80 percent of the time. On 12 randomly selected trips to work, what’s the chance that Bob makes it on time at least 10 times?arrow_forwardYour chance of winning a small prize in a scratch-off ticket is 10 percent. You buy five tickets. What’s the chance you will win at least one prize?arrow_forward
- Suppose that 60 percent of families own a pet. You randomly sample four families. What is the chance that two or three of them own a pet?arrow_forwardIf 40 percent of university students purchase their textbooks online, in a random sample of five students, what’s the chance that exactly one of them purchased their textbooks online?arrow_forwardA stoplight is green 40 percent of the time. If you stop at this light eight random times, what is the chance that it’s green exactly five times?arrow_forward
 Big Ideas Math A Bridge To Success Algebra 1: Stu...AlgebraISBN:9781680331141Author:HOUGHTON MIFFLIN HARCOURTPublisher:Houghton Mifflin Harcourt
 Holt Mcdougal Larson Pre-algebra: Student Edition...AlgebraISBN:9780547587776Author:HOLT MCDOUGALPublisher:HOLT MCDOUGAL
 Glencoe Algebra 1, Student Edition, 9780079039897...AlgebraISBN:9780079039897Author:CarterPublisher:McGraw Hill