DATA In one experiment the electric field is measured for points at distances r from a uniform line of charge that has charge per unit length λ and length l , where l >> r . In a second experiment the electric field is measured for points at distances r from the center of a uniformly charged insulating sphere that has volume charge density ρ and radius R = 8.00 mm, where r > R . The results of the two measurements are listed in the table, but you aren’t told which set of data applies to which experiment: For each set of data, draw two graphs: one for Er 2 versus r and one for Er versus r . (a) Use these graphs to determine which data set, A or B, is for the uniform line of charge and which set is for the uniformly charged sphere. Explain your reasoning. (b) Use the graphs in part (a) to calculate λ for the uniform line of charge and ρ for the uniformly charged sphere.
DATA In one experiment the electric field is measured for points at distances r from a uniform line of charge that has charge per unit length λ and length l , where l >> r . In a second experiment the electric field is measured for points at distances r from the center of a uniformly charged insulating sphere that has volume charge density ρ and radius R = 8.00 mm, where r > R . The results of the two measurements are listed in the table, but you aren’t told which set of data applies to which experiment: For each set of data, draw two graphs: one for Er 2 versus r and one for Er versus r . (a) Use these graphs to determine which data set, A or B, is for the uniform line of charge and which set is for the uniformly charged sphere. Explain your reasoning. (b) Use the graphs in part (a) to calculate λ for the uniform line of charge and ρ for the uniformly charged sphere.
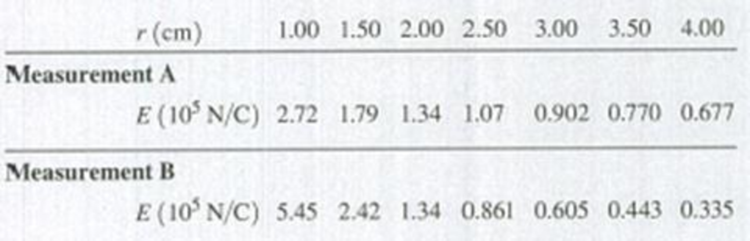
DATA In one experiment the electric field is measured for points at distances r from a uniform line of charge that has charge per unit length λ and length l, where l >> r. In a second experiment the electric field is measured for points at distances r from the center of a uniformly charged insulating sphere that has volume charge density ρ and radius R = 8.00 mm, where r > R. The results of the two measurements are listed in the table, but you aren’t told which set of data applies to which experiment:
For each set of data, draw two graphs: one for Er2 versus r and one for Er versus r. (a) Use these graphs to determine which data set, A or B, is for the uniform line of charge and which set is for the uniformly charged sphere. Explain your reasoning. (b) Use the graphs in part (a) to calculate λ for the uniform line of charge and ρ for the uniformly charged sphere.
Need a deep-dive on the concept behind this application? Look no further. Learn more about this topic, physics and related others by exploring similar questions and additional content below.


 Physics for Scientists and Engineers: Foundations...PhysicsISBN:9781133939146Author:Katz, Debora M.Publisher:Cengage Learning
 Principles of Physics: A Calculus-Based TextPhysicsISBN:9781133104261Author:Raymond A. Serway, John W. JewettPublisher:Cengage Learning
 College PhysicsPhysicsISBN:9781305952300Author:Raymond A. Serway, Chris VuillePublisher:Cengage Learning
 Physics for Scientists and Engineers, Technology ...PhysicsISBN:9781305116399Author:Raymond A. Serway, John W. JewettPublisher:Cengage Learning
 Physics for Scientists and Engineers with Modern ...PhysicsISBN:9781337553292Author:Raymond A. Serway, John W. JewettPublisher:Cengage Learning