Introduction:
Break-even point in terms of sales units: The break-even point in sales units is the company’s fixed costs divided by the contribution margin of the company. Here, the contribution margin of the company is the selling price less the variable cost.
Break-even point in terms of sales dollars: The break-even point in sales dollars is the company’s fixed costs divided by the contribution margin ratio of the company. Here, the contribution margin of the company is the selling price less the variable cost. And the contribution margin ratio of the company is the contribution margin divided by the selling price.
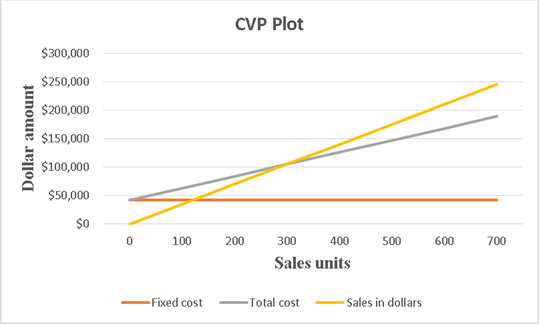
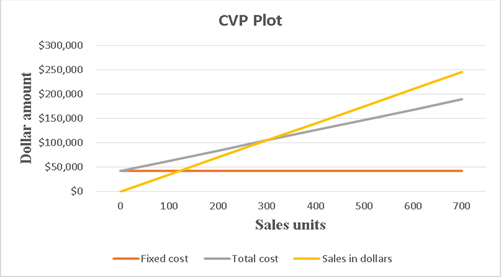
CVP Chart: CVP chart is the short form of a cost volume profit chart. It shows the relationship between the units produced in a particular period, total cost involved and the sales revenues in that period.
Contribution margin income statement: It is a statement where variable costs are deducted from the sales dollars to get the contribution margin and then all fixed costs are deducted from the contribution margin to get the net
1.
To calculate:
(a) Estimated Break-even point in terms of sales units
(b) Estimated Break-even point in terms of sales dollars
Answer to Problem 3BPSB
Solution:
(a) Estimated Break-even point in terms of sales units is 300.
(b) Estimated Break-even point in terms of sales dollars is $105,000
Explanation of Solution
Explanations:
Given:
Fixed costs= $42,000
Selling price= $350 per unit
Calculation:
Here, the given variable cost is the forecasted one, so the calculated value is for the estimated break-even point in terms of sales unit.
Here, the given variable cost is the forecasted one, so the calculated value is for the estimated break-even point in terms of sales dollars.
2.
To Prepare:
A CVP chart
Answer to Problem 3BPSB
Solution:

Explanation of Solution
Explanations:
Given:
Maximum number of sales = 700
Maximum sales revenue = $245,000
Fixed costs= $42,000
Forecasted variable cost= $210 per unit
A CVP graph has graph lines for fixed cost, total cost and sales revenue. Here, fixed cost and maximum sales are known. Now total cost at maximum number of sales has to be calculated.
Calculation:
The formula for total cost is given below.
Based on these information, a table showing fixed cost, total cost and sales in dollars at different label of sales can be constructed as shown below.
| Sales units | Fixed cost | Total cost | Sales in dollars |
| 0 | $42,000 | $42,000 | $ - |
| 100 | $42,000 | $63,000 | $ 35,000 |
| 200 | $42,000 | $84,000 | $ 70,000 |
| 300 | $42,000 | $105,000 | $ 105,000 |
| 400 | $42,000 | $126,000 | $ 140,000 |
| 500 | $42,000 | $147,000 | $ 175,000 |
| 600 | $42,000 | $168,000 | $ 210,000 |
| 700 | $42,000 | $189,000 | $ 245,000 |
In the above table, total costs at different units of sales are calculated using the above given formula and sales in dollars are the sales units times the selling price.
By selecting this table in excel sheet, the required CVP chart is prepared as shown below.

3.
To Show:
Contribution margin income statement at break-even point
Answer to Problem 3BPSB
Solution:
| Contribution margin income statement | |
| Sales | $105,000 |
| Less Variable costs | $63,000 |
| Contribution margin | $42,000 |
| Less Fixed cost | $42,000 |
| Net profit | $0 |
Explanation of Solution
Explanations:
Given:
Fixed costs= $42,000
Selling price= $350 per unit
Forecasted variable cost= $210 per unit
Break-even point sales units= 300
Calculation:
Based on these calculations, a contribution margin income statement is prepared as shown below.
| Contribution margin income statement | |
| Sales | $105,000 |
| Less Variable costs | $63,000 |
| Contribution margin | $42,000 |
| Less Fixed cost | $42,000 |
| Net profit | $0 |
At break-even point, net profit must be zero as shown by the above contribution margin income statement.
Want to see more full solutions like this?
Chapter 21 Solutions
Connect Access Card for Fundamental Accounting Principles
- During the month of May, Nakamura Manufacturing used $45,300 of direct materials and incurred $53,700 of direct labor costs. Nakamura applied overhead to products in the amount of $32,400. If the cost of goods manufactured was $169,000 and the ending work in process balance was $31,200, the beginning work in process must have been equal to _. Helparrow_forwardWhat is plantwide overhead rate?arrow_forwardCan you help me solve this financial accounting problem with the correct methodology?arrow_forward
- Can you help me solve this general accounting question using the correct accounting procedures?arrow_forwardPlease explain the correct approach for solving this general accounting question.arrow_forwardI am trying to find the accurate solution to this financial accounting problem with the correct explanation.arrow_forward
- I need help finding the accurate solution to this general accounting problem with valid methods.arrow_forwardHi expert please given correct answer with accounting questionarrow_forwardThe Evangeline Company makes two products, X and Y, from a common input, Z. In March, Evangeline used 30,000 pounds of Z to make 20,000 pounds of X and 10,000 pounds of Y. The cost of Z was $1.00 per pound and X and Y can be sold for $7.50 and $10.00, respectively; Evangeline incurred additional processing costs of $30,000 to further process X and $20,000 to further process Y. Using the net realizable value method, how much of the cost of Z should be allocated to X? Multiple Choice $22,000 None of the choices is correct. $20,000 $18,000 $16,000arrow_forward

 AccountingAccountingISBN:9781337272094Author:WARREN, Carl S., Reeve, James M., Duchac, Jonathan E.Publisher:Cengage Learning,
 Accounting Information SystemsAccountingISBN:9781337619202Author:Hall, James A.Publisher:Cengage Learning,
 Horngren's Cost Accounting: A Managerial Emphasis...AccountingISBN:9780134475585Author:Srikant M. Datar, Madhav V. RajanPublisher:PEARSON
 Intermediate AccountingAccountingISBN:9781259722660Author:J. David Spiceland, Mark W. Nelson, Wayne M ThomasPublisher:McGraw-Hill Education
 Financial and Managerial AccountingAccountingISBN:9781259726705Author:John J Wild, Ken W. Shaw, Barbara Chiappetta Fundamental Accounting PrinciplesPublisher:McGraw-Hill Education


