Introduction:
Break-even point in terms of sales units: The break-even point in sales units is the company’s fixed costs divided by the contribution margin of the company. Here, the contribution margin of the company is the selling price less the variable cost.
Break-even point in terms of sales dollars: The break-even point in sales dollars is the company’s fixed costs divided by the contribution margin ratio of the company. Here, the contribution margin of the company is the selling price less the variable cost. And the contribution margin ratio of the company is the contribution margin divided by the selling price.
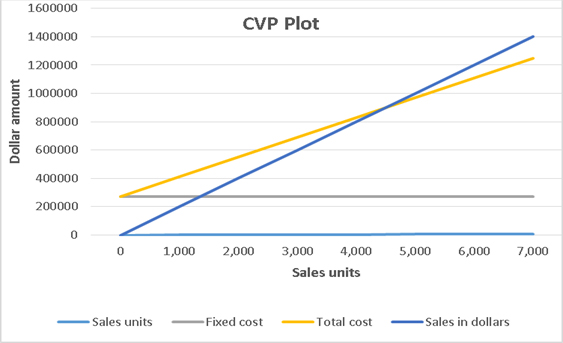
CVP Chart: CVP chart is the short form of a cost volume profit chart. It shows the relationship between the units produced in a particular period, total cost involved and the sales revenues in that period.
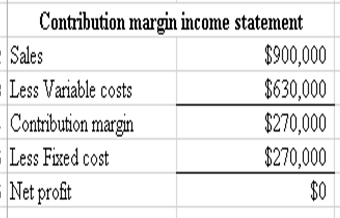
Contribution margin income statement: It is a statement where variable costs are deducted from the sales dollars to get the contribution margin and then all fixed costs are deducted from the contribution margin to get the net
1.
To calculate:
(a) Estimated Break-even point in terms of sales units
(b) Estimated Break-even point in terms of sales dollars
Answer to Problem 3APSA
Solution:
(a) Estimated Break-even point in terms of sales units is 4,500.
(b) Estimated Break-even point in terms of sales dollars is $900,000
Explanation of Solution
Explanations:
Given:
Fixed costs= $270,000
Selling price= $200 per 100 yards
Calculation:
Here, the given variable cost is the forecasted one, so the calculated value is for the estimated break-even point in terms of sales unit.
Here, the given variable cost is the forecasted one, so the calculated value is for the estimated break-even point in terms of sales dollars.
2.
To Prepare:
A CVP chart
Answer to Problem 3APSA
Solution:

Explanation of Solution
Explanations:
Given:
Maximum number of sales = 7,000
Maximum sales revenue = $1,400,000
Fixed costs= $270,000
Forecasted variable cost= $140 per 100 yards
A CVP graph has graph lines for fixed cost, total cost and sales revenue. Here, fixed cost and maximum sales are known. Now total cost at maximum number of sales has to be calculated.
Calculation:
The formula for total cost is given below.
Based on these information, a table showing fixed cost, total cost and sales revenue at different label of sales can be constructed as shown below.
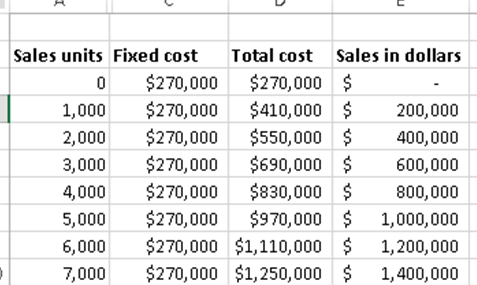
In the above table, Total costs at different units of sales are calculated using the above given formula and sales in dollars are the sales units times the selling price.
By selecting this table in excel sheet, the required CVP chart is prepared as shown below.
3.
To Show:
Contribution margin income statement at break-even point
Answer to Problem 3APSA
Solution:
Explanation of Solution
Explanations:
Given:
Fixed costs= $270,000
Selling price= $200 per 100 yards
Forecasted variable cost= $140 per 100 yards
Break-even point sales units= 4,500
Calculation:
Based on these calculations, a contribution margin income statement is prepared as shown below.
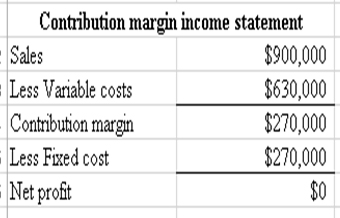
At break-even point, net profit must be zero as shown by the above contribution margin income statement.
Want to see more full solutions like this?
Chapter 21 Solutions
Loose Leaf for Fundamental Accounting Principles

- I need help solving this general accounting question with the proper methodology.arrow_forwardCan you solve this general accounting problem using appropriate accounting principles?arrow_forwardPlease provide the correct answer to this general accounting problem using valid calculations.arrow_forward
- Stockholders' equity at the end of the year was ____.arrow_forwardI need the correct answer to this general accounting problem using the standard accounting approach.arrow_forwardThe installation of a ______ system will create confidence in the minds of public about the fairness of the prices charged. a. Costing b. Financial accounting c. Management accounting d. Informationarrow_forward

 AccountingAccountingISBN:9781337272094Author:WARREN, Carl S., Reeve, James M., Duchac, Jonathan E.Publisher:Cengage Learning,
 Accounting Information SystemsAccountingISBN:9781337619202Author:Hall, James A.Publisher:Cengage Learning,
 Horngren's Cost Accounting: A Managerial Emphasis...AccountingISBN:9780134475585Author:Srikant M. Datar, Madhav V. RajanPublisher:PEARSON
 Intermediate AccountingAccountingISBN:9781259722660Author:J. David Spiceland, Mark W. Nelson, Wayne M ThomasPublisher:McGraw-Hill Education
 Financial and Managerial AccountingAccountingISBN:9781259726705Author:John J Wild, Ken W. Shaw, Barbara Chiappetta Fundamental Accounting PrinciplesPublisher:McGraw-Hill Education