Concept explainers
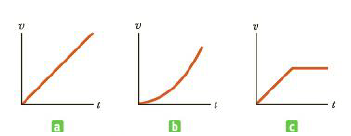
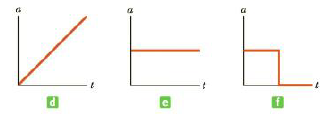
Parts (a), (b), and (c) of Figure 2.10 represent three graphs of the velocities of different objects moving in straight-line paths as functions of time. The possible accelerations of each object as functions of time are shown in parts (d), (c), and (f). Match each velocity vs. time graph with the acceleration vs. time graph that best describes the motion.
Figure 2.10 (Quick Quiz 2.3) Match each velocity vs. time graph to its corresponding acceleration vs. time graph.


Trending nowThis is a popular solution!

Chapter 2 Solutions
College Physics:
Additional Science Textbook Solutions
Introduction to Electrodynamics
The Cosmic Perspective
Applied Physics (11th Edition)
Physics: Principles with Applications
Physics for Scientists and Engineers: A Strategic Approach, Vol. 1 (Chs 1-21) (4th Edition)
Glencoe Physics: Principles and Problems, Student Edition
- Shown is a motion diagram of a car traveling down a street. The camera took one frame every second. A distance scale is provided.a. Use the scale to determine the x-value of the car at each dot. Place your data in a table, similar to Table 2.1, showing each position and the instant of time at which it occurred.b. Make a graph of x versus t, using the data in your table. Because you have data only at certain instants of time, your graph should consist of dots that are not connected together.arrow_forwardA motorcycle begins at rest at t0 = 0 seconds. The motorcycle starts moving, and eventually covers a distance d = 840 m, in a time tf = 189 s. In a coordinate system with north being the positive x-direction, the motorcycle's motion is in the northern direction (see figure). 1. What was the motorcycle's average velocity in in the northern direction vavg,N, in this period in meters per second? 2. If the motorcycle's final velocity at tf was 12 m/s, what was the motorcycle's average acceleration in the northern direction, aavg,N, during this period in m/s2?arrow_forwardA bicycle's velocity in the x direction, as a function of time is given by: vx(t) = alpha beta(t2). Alpha and beta are constants. 1.) What is the acceleration as a function of time? 2.) What is the position as a function of time? Assume the initial position at t=0 is y. 3. If alpha = 300m/s and beta = 0.100m/s3 and y = 2.00m, what are the positions, velocities, and accelerations at the locations below? t(s) x(m) v(m/s) a(m/s2 1 2 5 10arrow_forward
- solve in a detailed form. Show complete and clear solution. Thanksarrow_forwardA motorcycle begins at rest at t0 = 0 seconds. The motorcycle starts moving, and eventually covers a distance d = 840 m, in a time tf = 189 s. In a coordinate system with north being the positive x-direction, the motorcycle's motion is in the northern direction (see figure). 1. What was the motorcycle's average speed, vavg, during this period, in meters per second? 2. What was the motorcycle's displacement in the northern direction during this period, in meters?arrow_forwardThe graph of the velocity versus time for an object is as shown.: Ave 2 3 5 10 5 -5- -10- 1 (s) 6 a. Describe the motion of the object. How many times does it change direction? b. Find the average acceleration from t =3 s to t= 5 s.arrow_forward
- Can i get help step by step with this problem?arrow_forward22. A tennis ball travels down a ramp onto a table and at the end of the ramp has a velocity of .75 m/s. The ball is released from rest at the top of the ramp and travels 1.2 meters to the bottom. What is the acceleration as the ball travels down the ramp? Next create a velocity vs. time graph below taking care to label units and numbers properly. Give the equation for the graph in slope-intercept form (y = mx + b).arrow_forwardlo noltsineestooR lsoirdgeno nolloM Part B- Data for the Motion of a Passenger Jeepney Data Part A- Data for a Bicycle's Motion 1. Plot the tabulated data (d vs t) 2. Time will be in the x-axis and distance in the у-аxis. 3. Connect the points. Describe the graph. 1. Plot the given tabulated data (d vs t) 2. Time will be in the x-axis and distance in the y-axis. 3. Connect the points. Describe your graph. Table 3.2: Bicycle's Motion Table 3. 3: Passenger Jeepney's Motion Distance Time Distance Time d (m) t (s) d (km) t (h) 20 50 1 38 4 100 60 6 100 3 79 100 4 100 10 150 120 12 100 6 138 14 50 8 Table 3.4: Car's Motion Distance Time Part C- Data for the Motion of a Cat d (m) t (s) 01 1. Plot the distance against time (d-t graph) 2. Time will be in the x-axis and distänce in the y- 15.5 4.8 axis. 46.5 8.7 3. Connect the points. Describe the graph. 75.0 11.1 105.2 13.0 150.0 15.3 200.1 17.7arrow_forward
- 0s1s 2s 3s Om 2 m 8 m 18 m 32 m 50 m The diagram above presents the position and elapsed time of a motorbike that starts from rest and accelerates at a constant rate. Use it to answer questions 1 and 2. 1. What is the average velocity of the motorbike during first 5 s? A. O m/s B. 5 m/s 2. What is the acceleration of the motorbike? A. 0 m/s 3. An object moves at a constant speed of 6 m/s. This means that the object: A. Increases its speed by 6 m/s every second C. 10 m/s D. 15 m/s E. 20 m/s B. 2 m/s C. 4 m/s D. 6 m/s E. 8 m/s B. Decreases its speed by 6 m/s every second C. Doesn't move D. Has a positive acceleration E. Moves 6 meters every second 4. A toy car moves 8 m in 4 s at the constant velocity. What is the car's velocity? A. 1 m/s В. 2 m/s C. 3 m/s D. 4 m/s E. 5 m/s 5. A train moves at a constant velocity of 50 km/h. How far will it move in 0.5 h? C. 25 km A. 10 km B. 20 km D. 45 km E. 50 km 6. A boat can move at a constant velocity of 8 km/h in still water. How long will it take…arrow_forwardPlease help me to solve this. 1. A car is traveling at 65.2m/s . It slows to a stop at a constant rate for 2.5s. How far (in meters) does the car travel during this time before it stops? 2. A stone is thrown with an initial upward velocity of 23.1m/s and experiences negligible air resistance. If we take upward as the positive direction, what is the velocity (in m/s) of the stone after 7s? 3. If a projectile is launched with an initial vertical velocity of 83.7m/s, how long (in s) will it take to reach its highest point?arrow_forwardA honda civic is driven at 20 m/s for 12 mins, then 40 m/s for 20 min, and finally at 50 m/s for 8 min. a.) calculate the average speed over the interval. b.) How fast must the honda civic move in the last 8 mins of travel to obtain an average spee of 55 m/s?arrow_forward
 College PhysicsPhysicsISBN:9781305952300Author:Raymond A. Serway, Chris VuillePublisher:Cengage Learning
 University Physics (14th Edition)PhysicsISBN:9780133969290Author:Hugh D. Young, Roger A. FreedmanPublisher:PEARSON
 Introduction To Quantum MechanicsPhysicsISBN:9781107189638Author:Griffiths, David J., Schroeter, Darrell F.Publisher:Cambridge University Press
 Physics for Scientists and EngineersPhysicsISBN:9781337553278Author:Raymond A. Serway, John W. JewettPublisher:Cengage Learning
 Lecture- Tutorials for Introductory AstronomyPhysicsISBN:9780321820464Author:Edward E. Prather, Tim P. Slater, Jeff P. Adams, Gina BrissendenPublisher:Addison-Wesley
 College Physics: A Strategic Approach (4th Editio...PhysicsISBN:9780134609034Author:Randall D. Knight (Professor Emeritus), Brian Jones, Stuart FieldPublisher:PEARSON


