
Concept explainers
Videos
(a)
Percentile for Jackson owing 22 pairs of shoes.
(a)
Answer to Problem 1E
Percentile for Jackson is 85th percentile.
Explanation of Solution
Given information:
Let
n , Number of data values that are less than the individual’s data value
N , Total number of data values
Note that
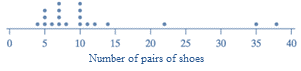
In the dotplot, 17 of the 20 dots lie to the left of 22.
Thus,
In the sample, 17 of the 20 individuals own less than 22 pairs of shoes.
Percentile can be determined as the number of data values that are less than the individual’s data value ( n ), divided by the total number of data values ( N ), written as percentage.
Thus,
Percentile that corresponds with 22 pairs of shoes is the 85th percentile.
(b)
Interpretation of 45th percentile and pairs of shoes owned by Raul.
(b)
Answer to Problem 1E
Raul owns 8 pairs of shoes and is at 45th percentile.
Explanation of Solution
Given information:

Let
n , Number of data values that are less than the individual’s data value
N , Total number of data values
Now,
Write down all the data values from the dotplot in ascending order, which are shown in the form of dots in the dotplot on horizontal axis.
4, 5, 5, 5, 6, 7, 7, 7, 7, 8, 10, 10, 10, 10, 11, 12, 14, 22, 35, 38.
Note that
In the sample, there are total 20 data values.
Such that
The data value represented by the xth percentile has x% of the data values below it.
If number of shoes pairs that Raul owns is at 45th percentile,
45th percentile has 45% of the data values below it.
Calculate 45% of 20 data values:
We have
9 out of 20 data values below 45th percentile.
45th percentile needs to be the 10th data value in the ascending order, and that is 8.
Thus,
Raul owns 8 pairs of shoes and is at 45th percentile.
Chapter 2 Solutions
PRACTICE OF STATISTICS F/AP EXAM
Additional Math Textbook Solutions
Basic Business Statistics, Student Value Edition
Precalculus
Thinking Mathematically (6th Edition)
Elementary Statistics
Calculus for Business, Economics, Life Sciences, and Social Sciences (14th Edition)
Calculus: Early Transcendentals (2nd Edition)


- Critically analyze the following graph and, based on statistical information, indicate the type of error it presents IN NO MORE THAN 3 LINES 13% APPROVE 4% DOESN'T KNOW DOESN'T RESPOND 5% NEITHER APPROVES NOR DISAPPROVES 78% DISAPPROVES SURVEY PRESIDENTIAL APPROVAL DROPS TO 13%arrow_forwardPlease help with this following question I'm not too sure if question (a) and (b) are correct and not sure how to calculate (c) The csv data is below "","New","Current" "1","67",66 "2","77",73 "3","76",73 "4","76",76 "5","77",79 "6","84",76 "7","71",78 "8","84",72 "9","73",76 "10","71",73 "11","72",77 "12","70",72 "13","75",72 "14","84",71 "15","77",73 "16","65",72 "17","69",73 "18","71",73 "19","79",71 "20","75",78 "21","76",69 "22","73",74 "23","76",71 "24","64",74 "25","81",78 "26","79",76 "27","70",77 "28","79",71 "29","84",73 "30","79",69 "31","69",72 "32","81",76 "33","77",70 "34","77",71 "35","71",69 "36","67",72 "37","70",76 "38","77",73 "39","82",73 "40","72",73arrow_forwardPlease help me answer the following question(c) A previous study found that 15% of nurses reported participating in mental health support programs.From the 96% found in (b) , can you conclude that proportion of nurses reported participating in mental health support programs p(current), has changed from the previous study?(Yes/No) because the confidence interval in (b) (captures/does not capture) 15%.(d) Refer to your answer in (b) : The Alberta Nurses Association expects that not more than 23 % of nurses will participate in the survey on mental health support programs. Given the result in part (b) can we conclude that this expectation is reasonable?(Yes/No) because the (upper bound/lower bound) of the 96% confidence interval is (less than/not less than/greater than) 23%. The Alberta Nursing Association conducts an annual survey to estimate the proportion of nurses who participate in mental health support programs. The most recent application of this survey involved a random sample of…arrow_forward
- Please help me solve this questionThis is what was in the csv file:"","Diabetic","Heart Disease""1",32644,30646"2",789,1670"3",12802,36274"4",2177,5011"5",1910,3300"6",3320,4256"7",61425,39053"8",19768,28635"9",19502,39546"10",5642,12182"11",107864,152098"12",29918,60433"13",2397,3550"14",41559,34705"15",49169,57948"16",72853,83100"17",2155,2873"18",140220,134517"19",28181,26212"20",18850,38637"21",69564,68582"22",13897,12613"23",6868,9138"24",9735,4767"25",12102,13447"26",36571,50010"27",44665,55141"28",26620,33970"29",25525,29766"30",14167,20206Q(b) From this, the relationship between these two variables is (non-existent/positive/negative) . I can categorize this relationship as being (strong/weak/moderate).Q(c) Drop down is (+/-)Q(d) Drop downs in order are __% of the (average/median/variation/standard deviation) in the (the number of people diagnosed with heart disease/the number of people diagnosed with diabetes)−variable can be explained by its (linear relationship/relationship)…arrow_forwardPlease help me answer the following question The drop down for question (e, f, and g) is (YES/NO) Based on the P-value above, the assumption of equal variances among the four machines (Is Met/Is Not Met) Based on the data, the average fill for machine 3 is (statistically lower than/statistically higher than/the same as/not statistically different than/statistically different than/Hard to say then when comparing to/Refuse to say when comparing to) machine 1.arrow_forwardBusiness Discussarrow_forward
- 1 for all k, and set o (ii) Let X1, X2, that P(Xkb) = x > 0. Xn be independent random variables with mean 0, suppose = and Var Xk. Then, for 0x) ≤2 exp-tx+121 Στ k=1arrow_forwardLemma 1.1 Suppose that g is a non-negative, non-decreasing function such that E g(X) 0. Then, E g(|X|) P(|X|> x) ≤ g(x)arrow_forwardProof of this Theorem Theorem 1.2 (i) Suppose that P(|X| ≤ b) = 1 for some b > 0, that E X = 0, and set Var X = o². Then, for 0 0, P(X > x) ≤ e−1x+1²², P(|X|> x) ≤ 2e−x+1² 0²arrow_forward
- State and prove the Morton's inequality Theorem 1.1 (Markov's inequality) Suppose that E|X|" 0, and let x > 0. Then, E|X|" P(|X|> x) ≤ x"arrow_forward(iii) If, in addition, X1, X2, ... Xn are identically distributed, then P(S|>x) ≤2 exp{-tx+nt²o}}.arrow_forward5. State space models Consider the model T₁ = Tt−1 + €t S₁ = 0.8S-4+ Nt Y₁ = T₁ + S₁ + V₂ where (+) Y₁,..., Y. ~ WN(0,σ²), nt ~ WN(0,σ2), and (V) ~ WN(0,0). We observe data a. Write the model in the standard (matrix) form of a linear Gaussian state space model. b. Does lim+++∞ Var (St - St|n) exist? If so, what is its value? c. Does lim∞ Var(T₁ — Ît\n) exist? If so, what is its value?arrow_forward
 MATLAB: An Introduction with ApplicationsStatisticsISBN:9781119256830Author:Amos GilatPublisher:John Wiley & Sons Inc
 Probability and Statistics for Engineering and th...StatisticsISBN:9781305251809Author:Jay L. DevorePublisher:Cengage Learning
 Statistics for The Behavioral Sciences (MindTap C...StatisticsISBN:9781305504912Author:Frederick J Gravetter, Larry B. WallnauPublisher:Cengage Learning
 Elementary Statistics: Picturing the World (7th E...StatisticsISBN:9780134683416Author:Ron Larson, Betsy FarberPublisher:PEARSON
 The Basic Practice of StatisticsStatisticsISBN:9781319042578Author:David S. Moore, William I. Notz, Michael A. FlignerPublisher:W. H. Freeman
 Introduction to the Practice of StatisticsStatisticsISBN:9781319013387Author:David S. Moore, George P. McCabe, Bruce A. CraigPublisher:W. H. Freeman