
Concept explainers
Observations suggest that it takes more than 3 million years for the dust to begin clearing out of the inner regions of the disks surrounding protostars. Suppose this is the minimum time required to form a planet. Would you expect to find a planet around a 10-MSunstar? (Refer to Figure 21.12.)
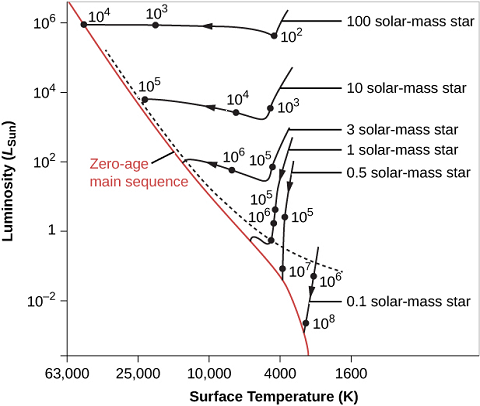
Figure 21.12 Evolutionary Tracks for Contracting Protostars. Tracks are plotted on the H−R diagram to show how stars of different masses change during the early parts of their lives. The number next to each dark point on a track is the rough number of years it takes an embryo star to reach that stage (the numbers are the result of computer models and are therefore not well known). Note that the surface temperature (K) on the horizontal axis increases toward the left. You can see that the more mass a star has, the shorter time it takes to go through each stage. Stars above the dashed line are typically still surrounded by infalling material and are hidden by it.
Trending nowThis is a popular solution!

Chapter 21 Solutions
Astronomy
Additional Science Textbook Solutions
Applications and Investigations in Earth Science (9th Edition)
Biology: Life on Earth with Physiology (11th Edition)
Genetic Analysis: An Integrated Approach (3rd Edition)
College Physics: A Strategic Approach (3rd Edition)
Laboratory Experiments in Microbiology (12th Edition) (What's New in Microbiology)
Cosmic Perspective Fundamentals
- 3. An Atwood machine consists of two masses, mA and m B, which are connected by an inelastic cord of negligible mass that passes over a pulley. If the pulley has radius RO and moment of inertia I about its axle, determine the acceleration of the masses mA and m B, and compare to the situation where the moment of inertia of the pulley is ignored. Ignore friction at the axle O. Use angular momentum and torque in this solutionarrow_forwardA 0.850-m-long metal bar is pulled to the right at a steady 5.0 m/s perpendicular to a uniform, 0.650-T magnetic field. The bar rides on parallel metal rails connected through a 25-Ω, resistor (Figure 1), so the apparatus makes a complete circuit. Ignore the resistance of the bar and the rails. Please explain how to find the direction of the induced current.arrow_forwardFor each of the actions depicted, determine the direction (right, left, or zero) of the current induced to flow through the resistor in the circuit containing the secondary coil. The coils are wrapped around a plastic core. Immediately after the switch is closed, as shown in the figure, (Figure 1) in which direction does the current flow through the resistor? If the switch is then opened, as shown in the figure, in which direction does the current flow through the resistor? I have the answers to the question, but would like to understand the logic behind the answers. Please show steps.arrow_forward
- When violet light of wavelength 415 nm falls on a single slit, it creates a central diffraction peak that is 8.60 cm wide on a screen that is 2.80 m away. Part A How wide is the slit? ΟΙ ΑΣΦ ? D= 2.7.10-8 Submit Previous Answers Request Answer × Incorrect; Try Again; 8 attempts remaining marrow_forwardTwo complex values are z1=8 + 8i, z2=15 + 7 i. z1∗ and z2∗ are the complex conjugate values. Any complex value can be expessed in the form of a+bi=reiθ. Find θ for (z1-z∗2)/z1+z2∗. Find r and θ for (z1−z2∗)z1z2∗ Please show all stepsarrow_forwardCalculate the center of mass of the hollow cone shown below. Clearly specify the origin and the coordinate system you are using. Z r Y h Xarrow_forward
- 12. If all three collisions in the figure below are totally inelastic, which will cause more damage? (think about which collision has a larger amount of kinetic energy dissipated/lost to the environment? I m II III A. I B. II C. III m m v brick wall ע ע 0.5v 2v 0.5m D. I and II E. II and III F. I and III G. I, II and III (all of them) 2marrow_forwardCan you solve this 2 question teach me step by step and draw for mearrow_forwardFrom this question and answer can you explain how get (0,0,5) and (5,0,,0) and can you teach me how to solve thisarrow_forward
- Can you solve this 2 question and teach me using ( engineer method formula)arrow_forward11. If all three collisions in the figure below are totally inelastic, which brings the car of mass (m) on the left to a halt? I m II III m m ע ע ע brick wall 0.5v 2m 2v 0.5m A. I B. II C. III D. I and II E. II and III F. I and III G. I, II and III (all of them)arrow_forwardHow can you tell which vowel is being produced here ( “ee,” “ah,” or “oo”)? Also, how would you be able to tell for the other vowels?arrow_forward
 AstronomyPhysicsISBN:9781938168284Author:Andrew Fraknoi; David Morrison; Sidney C. WolffPublisher:OpenStax
 Stars and Galaxies (MindTap Course List)PhysicsISBN:9781337399944Author:Michael A. SeedsPublisher:Cengage Learning
 Horizons: Exploring the Universe (MindTap Course ...PhysicsISBN:9781305960961Author:Michael A. Seeds, Dana BackmanPublisher:Cengage Learning
 Foundations of Astronomy (MindTap Course List)PhysicsISBN:9781337399920Author:Michael A. Seeds, Dana BackmanPublisher:Cengage Learning

 Stars and GalaxiesPhysicsISBN:9781305120785Author:Michael A. Seeds, Dana BackmanPublisher:Cengage Learning


