
UNDERSTANDING BASIC STAT LL BUND >A< F
7th Edition
ISBN: 9781337372763
Author: BRASE
Publisher: Cengage Learning
expand_more
expand_more
format_list_bulleted
Concept explainers
Videos
Textbook Question
Chapter 2.1, Problem 12P
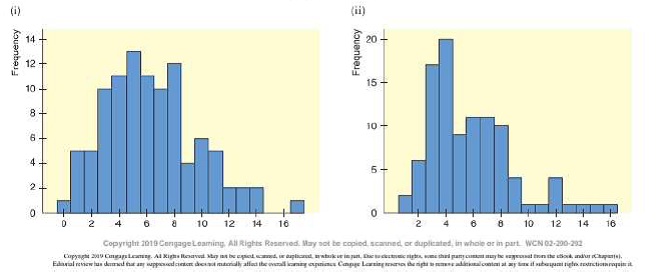
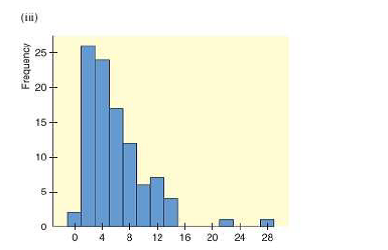
Interpretation The following histograms are based on different random
(a) Identify the midpoint of the class with the highest frequency in each of the three histograms
(b) Using the class midpoint, what is the
(c) Based on your study of random sample in Chapter 1, is it surprising to see the variations in the samples as displayed in the histograms? The original population from which the samples were drawn is skewed right with a high frequency near 4. Do all three random samples seem to reflect these properties equally well?
Expert Solution & Answer

Trending nowThis is a popular solution!

Students have asked these similar questions
21. ANALYSIS OF LAST DIGITS Heights of statistics students were obtained by the author as
part of an experiment conducted for class. The last digits of those heights are listed below.
Construct a frequency distribution with 10 classes. Based on the distribution, do the
heights appear to be reported or actually measured? Does there appear to be a gap in the
frequencies and, if so, how might that gap be explained? What do you know about the
accuracy of the results?
3 4
555
0 0 0 0 0 0 0 0 0 1 1 23 3
5 5 5 5 5 5 5 5 5 5 5 5 6 6 8 8 8 9
A side view of a recycling bin lid is diagramed below where two panels come together at a right angle.
45 in
24 in
Width? —
Given this information, how wide is the recycling bin in inches?
1 No.
2
3
4
Binomial Prob.
X
n
P
Answer
5
6 4
7
8
9
10
12345678
8
3
4
2
2552
10
0.7
0.233
0.3
0.132
7
0.6
0.290
20
0.02
0.053
150
1000
0.15
0.035
8
7
10
0.7
0.383
11
9
3
5
0.3
0.132
12
10
4
7
0.6
0.290
13
Poisson Probability
14
X
lambda
Answer
18 4
19
20
21
22
23 9
15
16
17 3
1234567829
3
2
0.180
2
1.5
0.251
12
10
0.095
5
3
0.101
7
4
0.060
3
2
0.180
2
1.5
0.251
24 10
12
10
0.095
Chapter 2 Solutions
UNDERSTANDING BASIC STAT LL BUND >A< F
Ch. 2.1 - Statistical Literacy What is the difference...Ch. 2.1 - Statistical Literacy A data set has values ranging...Ch. 2.1 - Statistical Literacy A data set has values ranging...Ch. 2.1 - Statistical Literacy A data set has value ranging...Ch. 2.1 - Basic Computation: Class Limits A data set with...Ch. 2.1 - Basic Computation: Class limits A data set with...Ch. 2.1 - Interpretation You are manager of a specialty...Ch. 2.1 - Critical Thinking A web site rated 100 colleges...Ch. 2.1 - Critical Thinking Look at the histogram in Figure...Ch. 2.1 - Critical Thinking The following data represent...
Ch. 2.1 - Interpretation Histograms of random sample data...Ch. 2.1 - Interpretation The following histograms are based...Ch. 2.1 - Interpretation The ogives shown are based on U.S...Ch. 2.1 - Critical Thinking The following ogives come from...Ch. 2.1 - For Problems 15-20. use the specified number of...Ch. 2.1 - For Problems 15-20, use the specified number of...Ch. 2.1 - For Problems 15-20, use the specified number of...Ch. 2.1 - For Problems 15-20, use the specified number of...Ch. 2.1 - Prob. 19PCh. 2.1 - Prob. 20PCh. 2.1 - Expand Your knowledge: Decimal Data The fallowing...Ch. 2.1 - Decimal Data: Batting Averages The following data...Ch. 2.1 - Expand Your Knowledge: Dotplot another display...Ch. 2.1 - 24. Dotplot: Sled Dog Racing Make a dotplot for...Ch. 2.1 - Prob. 25PCh. 2.2 - 1. Interpretation Consider graph (a) of Reasons...Ch. 2.2 - Interpretation Look at graph (b) of Reasons People...Ch. 2.2 - Critical Thinking A personnel office is gathering...Ch. 2.2 - Critical Thinking Your friend is thinking about...Ch. 2.2 - Prob. 5PCh. 2.2 - Interpretation Consider the two graphs depicting...Ch. 2.2 - Commercial Fishing: Gulf of Alaska It's not an...Ch. 2.2 - Archaeology: Ireland Commercial dredging...Ch. 2.2 - Lifestyle: Hide the Mess! A survey of 1000 adults...Ch. 2.2 - Education: College Professors' Time How do college...Ch. 2.2 - FBI Report: Hawaii In the Aloha state, you are...Ch. 2.2 - Driving: Bad Habits Driving would be more pleasant...Ch. 2.2 - Prob. 13PCh. 2.2 - Vital Statistics: Height How dies average height...Ch. 2.2 - Expand Your Knowledge Donut Pie Charts The book...Ch. 2.2 - Technology: Cars The following cluster bar graph...Ch. 2.3 - Cowboys: Longevity How long did real cowboys live?...Ch. 2.3 - Ecology: Habitat Wetlands offer a diversity of...Ch. 2.3 - Prob. 3PCh. 2.3 - Health Care: Hospitals Using the number of...Ch. 2.3 - Prob. 5PCh. 2.3 - Prob. 6PCh. 2.3 - Are cigarettes bad for people? Cigarette smoking...Ch. 2.3 - Are cigarettes bad for people? Cigarette smoking...Ch. 2.3 - Are cigarettes bad for people? Cigarette smoking...Ch. 2.3 - Expand Your Knowledge: Back-to-Back Stem Plot In...Ch. 2 - Critical Thinking Consider these types of graphs:...Ch. 2 - Critical Thinking A consumer interest group is...Ch. 2 - Critical Thinking Describe how data outliers might...Ch. 2 - Expand Your Knowledge How are dotplots and...Ch. 2 - Focus Problem: Fuel Economy Solve the focus...Ch. 2 - Criminal Justice: Prisoners The time plot in...Ch. 2 - IRS: Tax Returns Almost everyone files (or will...Ch. 2 - Prob. 8CRCh. 2 - Prob. 9CRCh. 2 - Law: Corporation Lawsuits Many people say the...Ch. 2 - Archaeology: Tree-King DataThe Sand Canyon...Ch. 2 - Interpretation A Harm Poll surveyed 2085 U.S....Ch. 2 - Examine Figure 2-20, Everyone Agrees: Slobs Make...Ch. 2 - Examine Figure 2-21, Global Teen Worries. How many...Ch. 2 - In your own words, explain the differences among...Ch. 2 - What do we mean when we say a histogram is skewed...Ch. 2 - Discuss the statement that stem-and-leaf displays...Ch. 2 - The following tables show the first-round winning...Ch. 2 - The following tables show the first-round winning...Ch. 2 - The Following tables show the first-round winning...
Knowledge Booster


Learn more about
Need a deep-dive on the concept behind this application? Look no further. Learn more about this topic, statistics and related others by exploring similar questions and additional content below.Similar questions
- step by step on Microssoft on how to put this in excel and the answers please Find binomial probability if: x = 8, n = 10, p = 0.7 x= 3, n=5, p = 0.3 x = 4, n=7, p = 0.6 Quality Control: A factory produces light bulbs with a 2% defect rate. If a random sample of 20 bulbs is tested, what is the probability that exactly 2 bulbs are defective? (hint: p=2% or 0.02; x =2, n=20; use the same logic for the following problems) Marketing Campaign: A marketing company sends out 1,000 promotional emails. The probability of any email being opened is 0.15. What is the probability that exactly 150 emails will be opened? (hint: total emails or n=1000, x =150) Customer Satisfaction: A survey shows that 70% of customers are satisfied with a new product. Out of 10 randomly selected customers, what is the probability that at least 8 are satisfied? (hint: One of the keyword in this question is “at least 8”, it is not “exactly 8”, the correct formula for this should be = 1- (binom.dist(7, 10, 0.7,…arrow_forwardKate, Luke, Mary and Nancy are sharing a cake. The cake had previously been divided into four slices (s1, s2, s3 and s4). What is an example of fair division of the cake S1 S2 S3 S4 Kate $4.00 $6.00 $6.00 $4.00 Luke $5.30 $5.00 $5.25 $5.45 Mary $4.25 $4.50 $3.50 $3.75 Nancy $6.00 $4.00 $4.00 $6.00arrow_forwardFaye cuts the sandwich in two fair shares to her. What is the first half s1arrow_forward
- Question 2. An American option on a stock has payoff given by F = f(St) when it is exercised at time t. We know that the function f is convex. A person claims that because of convexity, it is optimal to exercise at expiration T. Do you agree with them?arrow_forwardQuestion 4. We consider a CRR model with So == 5 and up and down factors u = 1.03 and d = 0.96. We consider the interest rate r = 4% (over one period). Is this a suitable CRR model? (Explain your answer.)arrow_forwardQuestion 3. We want to price a put option with strike price K and expiration T. Two financial advisors estimate the parameters with two different statistical methods: they obtain the same return rate μ, the same volatility σ, but the first advisor has interest r₁ and the second advisor has interest rate r2 (r1>r2). They both use a CRR model with the same number of periods to price the option. Which advisor will get the larger price? (Explain your answer.)arrow_forward
- Question 5. We consider a put option with strike price K and expiration T. This option is priced using a 1-period CRR model. We consider r > 0, and σ > 0 very large. What is the approximate price of the option? In other words, what is the limit of the price of the option as σ∞. (Briefly justify your answer.)arrow_forwardQuestion 6. You collect daily data for the stock of a company Z over the past 4 months (i.e. 80 days) and calculate the log-returns (yk)/(-1. You want to build a CRR model for the evolution of the stock. The expected value and standard deviation of the log-returns are y = 0.06 and Sy 0.1. The money market interest rate is r = 0.04. Determine the risk-neutral probability of the model.arrow_forwardSeveral markets (Japan, Switzerland) introduced negative interest rates on their money market. In this problem, we will consider an annual interest rate r < 0. We consider a stock modeled by an N-period CRR model where each period is 1 year (At = 1) and the up and down factors are u and d. (a) We consider an American put option with strike price K and expiration T. Prove that if <0, the optimal strategy is to wait until expiration T to exercise.arrow_forward
- We consider an N-period CRR model where each period is 1 year (At = 1), the up factor is u = 0.1, the down factor is d = e−0.3 and r = 0. We remind you that in the CRR model, the stock price at time tn is modeled (under P) by Sta = So exp (μtn + σ√AtZn), where (Zn) is a simple symmetric random walk. (a) Find the parameters μ and σ for the CRR model described above. (b) Find P Ste So 55/50 € > 1). StN (c) Find lim P 804-N (d) Determine q. (You can use e- 1 x.) Ste (e) Find Q So (f) Find lim Q 004-N StN Soarrow_forwardIn this problem, we consider a 3-period stock market model with evolution given in Fig. 1 below. Each period corresponds to one year. The interest rate is r = 0%. 16 22 28 12 16 12 8 4 2 time Figure 1: Stock evolution for Problem 1. (a) A colleague notices that in the model above, a movement up-down leads to the same value as a movement down-up. He concludes that the model is a CRR model. Is your colleague correct? (Explain your answer.) (b) We consider a European put with strike price K = 10 and expiration T = 3 years. Find the price of this option at time 0. Provide the replicating portfolio for the first period. (c) In addition to the call above, we also consider a European call with strike price K = 10 and expiration T = 3 years. Which one has the highest price? (It is not necessary to provide the price of the call.) (d) We now assume a yearly interest rate r = 25%. We consider a Bermudan put option with strike price K = 10. It works like a standard put, but you can exercise it…arrow_forwardIn this problem, we consider a 2-period stock market model with evolution given in Fig. 1 below. Each period corresponds to one year (At = 1). The yearly interest rate is r = 1/3 = 33%. This model is a CRR model. 25 15 9 10 6 4 time Figure 1: Stock evolution for Problem 1. (a) Find the values of up and down factors u and d, and the risk-neutral probability q. (b) We consider a European put with strike price K the price of this option at time 0. == 16 and expiration T = 2 years. Find (c) Provide the number of shares of stock that the replicating portfolio contains at each pos- sible position. (d) You find this option available on the market for $2. What do you do? (Short answer.) (e) We consider an American put with strike price K = 16 and expiration T = 2 years. Find the price of this option at time 0 and describe the optimal exercising strategy. (f) We consider an American call with strike price K ○ = 16 and expiration T = 2 years. Find the price of this option at time 0 and describe…arrow_forward
arrow_back_ios
SEE MORE QUESTIONS
arrow_forward_ios
Recommended textbooks for you
 Holt Mcdougal Larson Pre-algebra: Student Edition...AlgebraISBN:9780547587776Author:HOLT MCDOUGALPublisher:HOLT MCDOUGAL
 College Algebra (MindTap Course List)AlgebraISBN:9781305652231Author:R. David Gustafson, Jeff HughesPublisher:Cengage Learning
 Glencoe Algebra 1, Student Edition, 9780079039897...AlgebraISBN:9780079039897Author:CarterPublisher:McGraw Hill
Holt Mcdougal Larson Pre-algebra: Student Edition...
Algebra
ISBN:9780547587776
Author:HOLT MCDOUGAL
Publisher:HOLT MCDOUGAL
College Algebra (MindTap Course List)
Algebra
ISBN:9781305652231
Author:R. David Gustafson, Jeff Hughes
Publisher:Cengage Learning
Glencoe Algebra 1, Student Edition, 9780079039897...
Algebra
ISBN:9780079039897
Author:Carter
Publisher:McGraw Hill
Types of Data: Nominal, Ordinal, Interval/Ratio - Statistics Help; Author: Dr Nic's Maths and Stats;https://www.youtube.com/watch?v=hZxnzfnt5v8;License: Standard YouTube License, CC-BY
Statistics 1.1.2 Types of Data; Author: Dr. Jack L. Jackson II;https://www.youtube.com/watch?v=UZ4kHJOuoec;License: Standard YouTube License, CC-BY