
Concept explainers
Videos
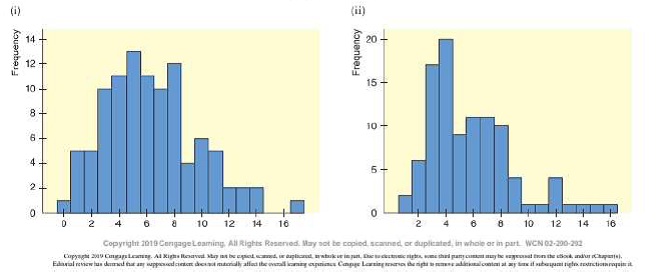
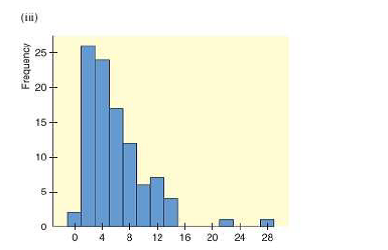
Interpretation The following histograms are based on different random
(a) Identify the midpoint of the class with the highest frequency in each of the three histograms
(b) Using the class midpoint, what is the
(c) Based on your study of random sample in Chapter 1, is it surprising to see the variations in the samples as displayed in the histograms? The original population from which the samples were drawn is skewed right with a high frequency near 4. Do all three random samples seem to reflect these properties equally well?

Trending nowThis is a popular solution!

Chapter 2 Solutions
Bundle: Understanding Basic Statistics, Loose-leaf Version, 7th + WebAssign Printed Access Card for Brase/Brase's Understanding Basic Statistics, ... for Peck's Statistics: Learning from Data


- Question 2 The data below provides the battery life of thirty eight (38) motorcycle batteries. 100 83 83 105 110 81 114 99 101 105 78 115 74 96 106 89 94 81 106 91 93 86 79 103 94 108 113 100 117 120 77 93 93 85 76 89 78 88 680 a. Test the hypothesis that mean battery life is greater than 90. Use the 1% level of significance. b. Determine if the mean battery life is different from 80. Use the 10% level of significance. Show all steps for the hypothesis test c. Would your conlcusion in part (b) change at the 5% level of significance? | d. Confirm test results in part (b) using JASP. Note: All JASP input files and output tables should be providedarrow_forwardSuppose that 80% of athletes at a certain college graduate. You randomly select eight athletes. What’s the chance that at most 7 of them graduate?arrow_forwardSuppose that you flip a fair coin four times. What’s the chance of getting at least one head?arrow_forward
- Suppose that the chance that an elementary student eats hot lunch is 30 percent. What’s the chance that, among 20 randomly selected students, between 6 and 8 students eat hot lunch (inclusive)?arrow_forwardBob’s commuting times to work are varied. He makes it to work on time 80 percent of the time. On 12 randomly selected trips to work, what’s the chance that Bob makes it on time at least 10 times?arrow_forwardYour chance of winning a small prize in a scratch-off ticket is 10 percent. You buy five tickets. What’s the chance you will win at least one prize?arrow_forward
- Suppose that 60 percent of families own a pet. You randomly sample four families. What is the chance that two or three of them own a pet?arrow_forwardIf 40 percent of university students purchase their textbooks online, in a random sample of five students, what’s the chance that exactly one of them purchased their textbooks online?arrow_forwardA stoplight is green 40 percent of the time. If you stop at this light eight random times, what is the chance that it’s green exactly five times?arrow_forward
 Holt Mcdougal Larson Pre-algebra: Student Edition...AlgebraISBN:9780547587776Author:HOLT MCDOUGALPublisher:HOLT MCDOUGAL
 College Algebra (MindTap Course List)AlgebraISBN:9781305652231Author:R. David Gustafson, Jeff HughesPublisher:Cengage Learning
 Glencoe Algebra 1, Student Edition, 9780079039897...AlgebraISBN:9780079039897Author:CarterPublisher:McGraw Hill