
Bundle: Understandable Statistics: Concepts And Methods, 12th + Jmp Printed Access Card For Peck's Statistics + Webassign Printed Access Card For ... And Methods, 12th Edition, Single-term
12th Edition
ISBN: 9781337758925
Author: Charles Henry Brase, Corrinne Pellillo Brase
Publisher: Cengage Learning
expand_more
expand_more
format_list_bulleted
Concept explainers
Videos
Textbook Question
Chapter 2.1, Problem 11P
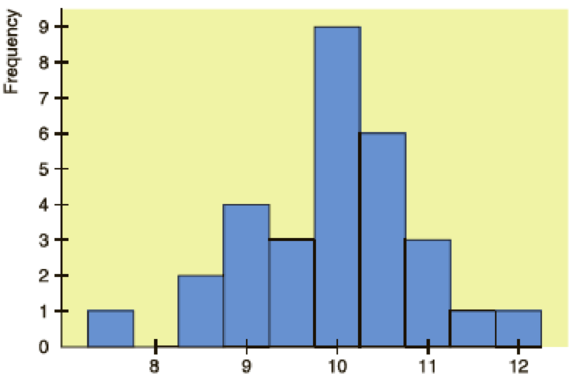
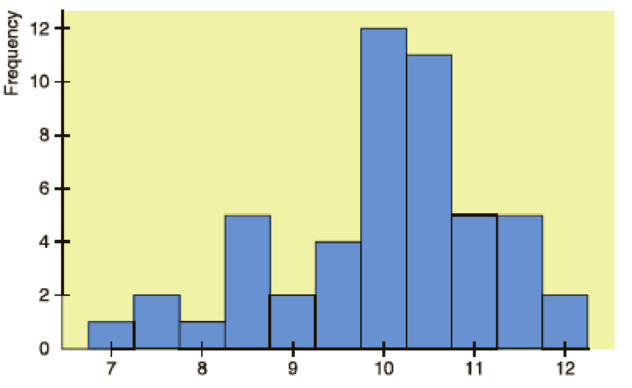
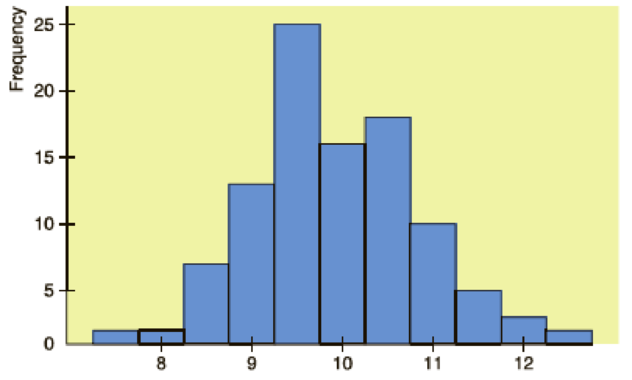
Interpretation Histograms of random sample data are often used as an indication of the shape of the underlying population distribution. The histograms on the next page are based on random samples of size 30, 50, and 100 from the same population.
- (a) Using the midpoint labels of the three histograms, what would you say about the estimated
range of the population data from smallest to largest? Does the bulk of the data seem to be between 8 and 12 in all three histograms? - (b) The population distribution from which the samples were drawn is symmetric and mound-shaped, with the top of the mound at 10, 95% of the data between 8 and 12, and 99.7% of data between 7 and 13. How well does each histogram reflect these characteristics?
- (i)
Sample of size 30
- (i)
- (ii) Sample of size 50
- (iii) Sample of size 100
Expert Solution & Answer
Want to see the full answer?
Check out a sample textbook solution
Students have asked these similar questions
The following data represent total ventilation measured in liters of air per minute per square meter of body area for two independent (and randomly chosen) samples.
Analyze these data using the appropriate non-parametric hypothesis test
each column represents before & after measurements on the same individual. Analyze with the appropriate non-parametric hypothesis test for a paired design.
Should you be confident in applying your regression equation to estimate the heart rate of a python at 35°C? Why or why not?
Chapter 2 Solutions
Bundle: Understandable Statistics: Concepts And Methods, 12th + Jmp Printed Access Card For Peck's Statistics + Webassign Printed Access Card For ... And Methods, 12th Edition, Single-term
Ch. 2.1 - Statistical Literacy What is the difference...Ch. 2.1 - Statistical Literacy A data set has values ranging...Ch. 2.1 - Statistical Literacy A data set has values ranging...Ch. 2.1 - Prob. 4PCh. 2.1 - Basic Computation: Class Limits A data set with...Ch. 2.1 - Prob. 6PCh. 2.1 - Interpretation You are manager of a specialty...Ch. 2.1 - Prob. 8PCh. 2.1 - Critical Thinking Look at the histogram in Figure...Ch. 2.1 - Critical Thinking The following data represent...
Ch. 2.1 - Interpretation Histograms of random sample data...Ch. 2.1 - Prob. 12PCh. 2.1 - Interpretation The ogives shown are based on U.S....Ch. 2.1 - Prob. 14PCh. 2.1 - For Problems 15-20, use the specified number of...Ch. 2.1 - For Problems 15-20, use the specified number of...Ch. 2.1 - For Problems 15-20, use the specified number of...Ch. 2.1 - Prob. 18PCh. 2.1 - For Problems 15-20, use the specified number of...Ch. 2.1 - Prob. 20PCh. 2.1 - Expand Your Knowledge: Decimal Data The following...Ch. 2.1 - Decimal Data: Batting Averages The following data...Ch. 2.1 - Expand Your Knowledge: Dotplot Another display...Ch. 2.1 - Prob. 24PCh. 2.1 - Dotplot: Tumor Recurrence Make a dotplot for the...Ch. 2.2 - Interpretation Consider graph (a) of Reasons...Ch. 2.2 - Reasons People Like Texting on Cell Phones (b)...Ch. 2.2 - Critical Thinking A personnel office is gathering...Ch. 2.2 - Prob. 4PCh. 2.2 - Education: Does College Pay Off? It is costly in...Ch. 2.2 - Prob. 6PCh. 2.2 - Commercial Fishing: Gulf of Alaska Its not an easy...Ch. 2.2 - Prob. 8PCh. 2.2 - Lifestyle: Hide the Mess! A survey of 1000 adults...Ch. 2.2 - Prob. 10PCh. 2.2 - FBI Report: Hawaii In the Aloha state, you are...Ch. 2.2 - Prob. 12PCh. 2.2 - Prob. 13PCh. 2.2 - Prob. 14PCh. 2.2 - Prob. 15PCh. 2.2 - Prob. 16PCh. 2.3 - Cowboys: Longevity How long did real cowboys live?...Ch. 2.3 - Ecology: Habitat Wetlands offer a diversity of...Ch. 2.3 - Health Care: Hospitals The American Medical...Ch. 2.3 - Health Care: Hospitals Using the number of...Ch. 2.3 - Expand Your Knowledge: Split Stem The Boston...Ch. 2.3 - Prob. 6PCh. 2.3 - Prob. 7PCh. 2.3 - Prob. 8PCh. 2.3 - Prob. 9PCh. 2.3 - Prob. 10PCh. 2 - Prob. 1CRPCh. 2 - Critical Thinking A consumer interest group is...Ch. 2 - Prob. 3CRPCh. 2 - Prob. 4CRPCh. 2 - Prob. 5CRPCh. 2 - Prob. 6CRPCh. 2 - Prob. 7CRPCh. 2 - Prob. 8CRPCh. 2 - Prob. 9CRPCh. 2 - Prob. 10CRPCh. 2 - Prob. 11CRPCh. 2 - Prob. 12CRPCh. 2 - Prob. 1DHCh. 2 - Prob. 2DHCh. 2 - In your own words, explain the differences among...Ch. 2 - What do we mean when we say a histogram is skewed...Ch. 2 - Discuss the statement that stem-and-leaf displays...Ch. 2 - Prob. 1UTCh. 2 - Prob. 2UTCh. 2 - Prob. 3UT
Knowledge Booster


Learn more about
Need a deep-dive on the concept behind this application? Look no further. Learn more about this topic, statistics and related others by exploring similar questions and additional content below.Similar questions
- Given your fitted regression line, what would be the residual for snake #5 (10 C)?arrow_forwardCalculate the 95% confidence interval around your estimate of r using Fisher’s z-transformation. In your final answer, make sure to back-transform to the original units.arrow_forwardCalculate Pearson’s correlation coefficient (r) between temperature and heart rate.arrow_forward
- A researcher wishes to estimate, with 90% confidence, the population proportion of adults who support labeling legislation for genetically modified organisms (GMOs). Her estimate must be accurate within 4% of the true proportion. (a) No preliminary estimate is available. Find the minimum sample size needed. (b) Find the minimum sample size needed, using a prior study that found that 65% of the respondents said they support labeling legislation for GMOs. (c) Compare the results from parts (a) and (b). ... (a) What is the minimum sample size needed assuming that no prior information is available? n = (Round up to the nearest whole number as needed.)arrow_forwardThe table available below shows the costs per mile (in cents) for a sample of automobiles. At a = 0.05, can you conclude that at least one mean cost per mile is different from the others? Click on the icon to view the data table. Let Hss, HMS, HLS, Hsuv and Hмy represent the mean costs per mile for small sedans, medium sedans, large sedans, SUV 4WDs, and minivans respectively. What are the hypotheses for this test? OA. Ho: Not all the means are equal. Ha Hss HMS HLS HSUV HMV B. Ho Hss HMS HLS HSUV = μMV Ha: Hss *HMS *HLS*HSUV * HMV C. Ho Hss HMS HLS HSUV =μMV = = H: Not all the means are equal. D. Ho Hss HMS HLS HSUV HMV Ha Hss HMS HLS =HSUV = HMVarrow_forwardQuestion: A company launches two different marketing campaigns to promote the same product in two different regions. After one month, the company collects the sales data (in units sold) from both regions to compare the effectiveness of the campaigns. The company wants to determine whether there is a significant difference in the mean sales between the two regions. Perform a two sample T-test You can provide your answer by inserting a text box and the answer must include: Null hypothesis, Alternative hypothesis, Show answer (output table/summary table), and Conclusion based on the P value. (2 points = 0.5 x 4 Answers) Each of these is worth 0.5 points. However, showing the calculation is must. If calculation is missing, the whole answer won't get any credit.arrow_forward
arrow_back_ios
SEE MORE QUESTIONS
arrow_forward_ios
Recommended textbooks for you
 Glencoe Algebra 1, Student Edition, 9780079039897...AlgebraISBN:9780079039897Author:CarterPublisher:McGraw Hill
 Big Ideas Math A Bridge To Success Algebra 1: Stu...AlgebraISBN:9781680331141Author:HOUGHTON MIFFLIN HARCOURTPublisher:Houghton Mifflin Harcourt
 Holt Mcdougal Larson Pre-algebra: Student Edition...AlgebraISBN:9780547587776Author:HOLT MCDOUGALPublisher:HOLT MCDOUGAL
Glencoe Algebra 1, Student Edition, 9780079039897...
Algebra
ISBN:9780079039897
Author:Carter
Publisher:McGraw Hill
Big Ideas Math A Bridge To Success Algebra 1: Stu...
Algebra
ISBN:9781680331141
Author:HOUGHTON MIFFLIN HARCOURT
Publisher:Houghton Mifflin Harcourt
Holt Mcdougal Larson Pre-algebra: Student Edition...
Algebra
ISBN:9780547587776
Author:HOLT MCDOUGAL
Publisher:HOLT MCDOUGAL
The Shape of Data: Distributions: Crash Course Statistics #7; Author: CrashCourse;https://www.youtube.com/watch?v=bPFNxD3Yg6U;License: Standard YouTube License, CC-BY
Shape, Center, and Spread - Module 20.2 (Part 1); Author: Mrmathblog;https://www.youtube.com/watch?v=COaid7O_Gag;License: Standard YouTube License, CC-BY
Shape, Center and Spread; Author: Emily Murdock;https://www.youtube.com/watch?v=_YyW0DSCzpM;License: Standard Youtube License