Concept explainers
Videos
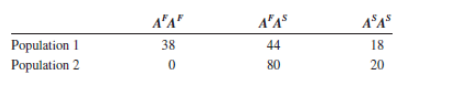
Two hypothetical lizard populations found on opposite sides of a mountain in the Arizonan desert have two alleles (AF, AS ) of a single gene A with the following three genotype frequencies:
| a. | What is the allele frequency of AF in the two populations? |
| b. | Do either of the two populations appear to be at Hardy-Weinberg equilibrium? |
| c. | A huge flood opened a canyon in the mountain range separating populations 1 and 2. They were then able to migrate such that the two populations, which were of equal size, mixed completely and mated at random. What are the frequencies of the three genotypes (AF AF, AF AS, and AS AS ) in the next generation of the single new population of lizards? |
a.
To determine:
The allele frequency of AF in the two populations.
Introduction:
The branch of genetics that studies the transmission of genetic material in a population is termed as population genetics. The proportion of gene copies that are of a common allele type in a population is termed as allele frequency. The allele frequency is important for understanding population genetics.
Explanation of Solution
The given information is as follows:
For population I:
Genotype frequency of AFAF = 38
Genotype frequency of AFAS = 44
Genotype frequency of ASAS = 18
Each genotype is composed of two alleles.
The formula to be used is as follows:
For population II:
Genotype frequency of AFAF = 0
Genotype frequency of AFAS = 80
Genotype frequency of ASAS = 20
Each genotype is composed of two alleles.
Thus, the allele frequency of AF in population I is 0.6 and allele frequency of AF in population II is 0.4.
b.
To determine:
Whether both the population appears to be at Hardy-Weinberg equilibrium.
Introduction:
Geoffrey H. Hardy was a scientist who proposed the concept of Hardy-Weinberg equilibrium. This concept is used to associate the allele frequency with the genotype frequency. The populations that have allele frequency and the genotypic frequency at equilibrium follow the concept of Hardy-Weinberg equilibrium.
Explanation of Solution
According to Hardy-Weinberg equilibrium:
Where:
p is the allele frequency of AF
q is the allele frequency of AS
For population I:
The allele frequency of AF (p) = 0.6
The allele frequency of AS (q) = 0.4
The formula to be used is as follows:
Substituting the value of p = 0.6 and q = 0.4 in the above formula gives the following result:
This indicates that the population I appear to be at Hardy-Weinberg equilibrium.
For population II:
The allele frequency of AF (p) = 0.4
The allele frequency of AS (q) = 0.6
The formula to be used is as follows:
Substituting the value of p = 0.4 and q = 0.6 in the above formula gives the following result:
This reflects that population II appears to be at Hardy-Weinberg equilibrium.
Thus, both population I and population II are at Hardy-Weinberg equilibrium.
c.
To determine:
The frequency of genotypes (AF AF, AF AS, and AS AS ) in the next generation.
Introduction:
The set of the alleles in DNA that carries the information for the expression of a trait in an individual is known as its genotype. For example, genotype ‘TT’ expresses the tallness in plants. The genotypes are responsible for controlling the expression of traits.
Explanation of Solution
The following table represents the population number of a single population after a natural calamity:
| Population | AF AF | AF AS | AS AS | Total |
| Population I | 38 | 44 | 18 | |
| Population II | 0 | 80 | 20 | |
| Single population |
Each genotype is composed of two alleles.
The formula to be used is as follows:
The allele frequency of AF is represented as “p”.
The allele frequency of AS is represented as “q”.
The frequencies of three genotypes among zygotes due to random mating are as follows:
Thus, the genotype frequency of AF AF in the next generation is 0.25, AF AS is 0.5, and AS AS is also 0.5.
Want to see more full solutions like this?
Chapter 21 Solutions
Genetics: From Genes to Genomes


- Biopharmaceutics and Pharmacokinetics:Two-Compartment Model Instant Absorption Questions Calculate these : a) B1, b) B2, c) hybrid rate constant (1) d) hybrid rate constant (2) e) t1/2,dist f) t1/2,elim g) k10 h) k12 i) k21 j) initial concentration (C0) k) central compartment volume (V1) l) steady-state volume (Vss) m) clearance (CL) AUC (0→10 min) using trapezoidal rule n) AUC (20→30 min) using trapezoidal rule o) AUCtail (AUC360→∞) p) total AUC (using short cut method) q) volume from AUC (VAUC)arrow_forwardUse the Henderson-Hasselbalch equation for a propanoic acid solution (CH₂CH₂CO₂H, pK₁ = 4.874) to calculate the quotient [A-]/[HA] at three different pH values. pH = 4.479 [A-] [HA] [A-] pH = 4.874 [HA] = pH = 5.220 [A-] = [HA]arrow_forwardIn order to establish the expiration date of perishable food, growth curve data must be collected. Once the microbial load is so high that it poses a hazard to human health, the food item is no longer considered safe (expired). Generally a load of x50,000 bacteria/gram is considered unsafe. Your task is to determine the microbial growth curves for MicroYo, a new brand of yogurt. The growth is determined by sampling the yogurt and growing the bacterial isolates in broth culture which is then serially diluted by a total of x10,000 and inoculated onto standard petri plates of nutrient agar. The following colony counts are measured: Time (days) MicroYo colony count# 1 1 4 1 12 2 16 20 4 7 What day should you recommend expiring the yogurt (the last possible date before the microbial load is unsafe). 12 4 20 16arrow_forward
- 9. Chicken combs in chickens is an example where you see interactions between genes. See potential genotypes and phenotypes below. Which genotype, when mated to a rose comb chicken, will produce progeny that are 50% walnut comb and 50% pea comb? walnut (RRPP) walnut (RrPP) pea (rrPP) walnut (RRPP) walnut (RrPp) pea (rrPp) rose rose single (RRPP) (Rrpp) (rrpp)arrow_forwardDescribe a compound light microscope and its importance in microbiology (2) examples of at least two microbes viewed under a compound light microscope and their general characteristics (note: the microbes you choose do not need to be the ones outlined in the above tutorial video) and (3) at least one source you used for the information included in your infographic.arrow_forwardPrice of visit Number of visits $700 0 $600 [1 $500 2 $400 3 $300 4 00000 The Table blow gives the demand curve for doctor visits for Elena. If the price of a doctor's visit is $600, and Elena does not have health insurance, she will visit the doctor times. If Elena obtains 50% coinsurance (the company pays 50% of the medical bill, Elena pays 50%), then Elena will visit the doctor times. 1; 2 0; 3 0; 2 1;4 2; 1arrow_forward
- P 200 150- 100 50 w/instrance/ w/insurance 2 100 Demand Assume that the white curve (labeled "Demand") represents an individual's true demand for this particular health care service. The coinsurance associated with insurance option 1 (in blue) is likely _. 0000 100% 25% 50% 0%arrow_forwardUse the figure below. Bob and Nancy have the same income and total utility.. willingness to pay for an insurance premium will be lower than because they are. risk- averse. Total utility Current utility Bob's utility Nancy's utility 0000 Bob; Nancy; less Nancy; Bob; less Nancy; Bob; more Bob; Nancy; more Current Income incomearrow_forwardConsider the figure below. Suppose the true price of a health care service is P1. Suppose further that the individual has obtained insurance that has a fixed copayment for this particular service. The copayment is represented by price P2. represents the quantity of the service the individual would consume without insurance. quantity of the service the individual would consume with the insurance. Health Care Service represents the P. P₂ a Q1;Q2 Q2; Q3 Q1; Q3 Q3; Q1 Q2; Q1 फ f Q ८ g d h Q3\D 7Q 00000arrow_forward
- The table shows the utility Jordan receives at various income levels, but they do not know what their income will be next year. There is a 15% chance their income will be $25,000, a 20% chance their income will be $35,000, and a 65% chance their income will be $45,000. We know that Jordan is Income $25,000 Utility 2,800 30,000 3,200 35,000 3,500 40,000 3,700 45,000 3,800 ☐ none of the above 0 000 risk taker (lover) because their marginal utility of income is increasing risk neutral because their marginal utility of income is constant risk averse because their marginal utility of income is decreasing risk neutral because their marginal utility of income is decreasingarrow_forwardOOOO a d+e d a+b+c Consider the figure below. Suppose the true price of a health care service is P1. Suppose further that the individual has obtained insurance that has a fixed copayment for this particular service. The copayment is represented by price P2. The social loss from moral hazard if the individual has copayment P2 is represented graphically by the area(s): Health Care Service P. a No 4 ८ e g Q2 Q3 Darrow_forwardOOO O The table shows the utility Jordan receives at various income levels, but they do not know what their income will be next year. There is a 15% chance their income will be $25,000, a 20% chance their income will be $35,000, and a 65% chance their income will be $45,000. We know that Jordan's expected income is. Their utility from their expected income is_ Income $25,000 Utility 2,800 30,000 3,200 35,000 3,500 40,000 3,700 45,000 3,800 $45,000; 3,800 $40,000; 3,700 $25,000; 2,800 $35,000; 3,500 $30,000; 3,200arrow_forward
 Human Heredity: Principles and Issues (MindTap Co...BiologyISBN:9781305251052Author:Michael CummingsPublisher:Cengage Learning
 Biology: The Dynamic Science (MindTap Course List)BiologyISBN:9781305389892Author:Peter J. Russell, Paul E. Hertz, Beverly McMillanPublisher:Cengage Learning
 Biology (MindTap Course List)BiologyISBN:9781337392938Author:Eldra Solomon, Charles Martin, Diana W. Martin, Linda R. BergPublisher:Cengage Learning
 Case Studies In Health Information ManagementBiologyISBN:9781337676908Author:SCHNERINGPublisher:Cengage
 Concepts of BiologyBiologyISBN:9781938168116Author:Samantha Fowler, Rebecca Roush, James WisePublisher:OpenStax College
 Human Biology (MindTap Course List)BiologyISBN:9781305112100Author:Cecie Starr, Beverly McMillanPublisher:Cengage Learning