Biology: The Dynamic Science (MindTap Course List)
4th Edition
ISBN: 9781305389892
Author: Peter J. Russell, Paul E. Hertz, Beverly McMillan
Publisher: Cengage Learning
expand_more
expand_more
format_list_bulleted
Concept explainers
Textbook Question
Chapter 20, Problem 1ITD
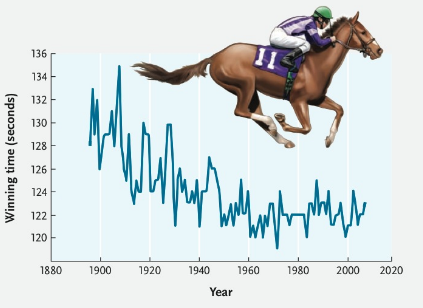
For centuries, animal breeders have used artificial selection to increase the speed of racehorses. The results of such efforts are illustrated in a graph that identifies how quickly winning horses ran the 1¼-mile track at the Kentucky Derby, a famous race held annually at Churchill Downs, Kentucky. (The time it takes a horse to run a track of fixed length is inversely proportional to the horse’s speed.) Based on the data in the graph, has artificial selection increased the speed of horses consistently between 1900 and 2000? Do you think that artificial selection can increase the speed of racehorses in the future?

Expert Solution & Answer
Trending nowThis is a popular solution!

Students have asked these similar questions
C
MasteringHealth MasteringNu ×
session.healthandnutrition-mastering.pearson.com/myct/itemView?assignment ProblemID=17396416&attemptNo=1&offset=prev
10. Your instructor will give you 2 amino acids during the activity session (video 2-7.
A. First color all the polar and non-polar covalent bonds in the R groups of your 2 amino acids
using the same colors as in #7. Do not color the bonds in the backbone of each amino acid.
B. Next, color where all the hydrogen bonds, hydrophobic interactions and ionic bonds could
occur in the R group of each amino acid. Use the same colors as in #7. Do not color the bonds
in the backbone of each amino acid.
C. Position the two amino acids on the page below in an orientation where the two R groups
could bond together. Once you are satisfied, staple or tape the amino acids in place and label
the bond that you formed between the two R groups.
- Polar covalent Bond - Red
- Non polar Covalent boND- yellow
- Ionic BonD - PINK
Hydrogen Bonn - Purple
Hydrophobic interaction-green
O=C-N
H
I.
H
HO
H
=O
CH2
C-C-N
HICK
H
HO
H
CH2
OH
H₂N
C = O
Find the dental formula and enter it in the following format:
I3/3 C1/1 P4/4 M2/3 = 42 (this is not the correct number, just the correct format)
Please be aware: the upper jaw is intact (all teeth are present). The bottom jaw/mandible is not intact. The front teeth should include 6 total rectangular teeth (3 on each side) and 2 total large triangular teeth (1 on each side).
Chapter 20 Solutions
Biology: The Dynamic Science (MindTap Course List)
Ch. 20.1 - Why did the existence of vestigial structures make...Ch. 20.1 - What were Lamarcks contributions to an...Ch. 20.1 - How do the concepts of gradualism and...Ch. 20.2 - What observations that Darwin made on his...Ch. 20.2 - How did Darwins understanding of artificial...Ch. 20.2 - What were the four great intellectual triumphs of...Ch. 20.3 - What two problems slowed the acceptance of Darwins...Ch. 20.3 - What is the difference between microevolution and...Ch. 20.3 - What types of data provide evidence that evolution...Ch. 20 - The father of taxonomy is: Charles Darwin. Charles...
Ch. 20 - The wings of birds, the legs of pigs, and the...Ch. 20 - Which of the following ideas proposed by Lamarck...Ch. 20 - Prob. 4TYKCh. 20 - Which of the following statements about...Ch. 20 - Which of the following ideas is not included in...Ch. 20 - Which of the following could be an example of...Ch. 20 - Medical advances now allow many people who suffer...Ch. 20 - Prob. 9TYKCh. 20 - Which of the following statements is not...Ch. 20 - Which of the following does not contribute to the...Ch. 20 - Prob. 12TYKCh. 20 - Design an experiment to test Lamarcks hypothesis...Ch. 20 - Prob. 14TYKCh. 20 - For centuries, animal breeders have used...
Knowledge Booster
Learn more about
Need a deep-dive on the concept behind this application? Look no further. Learn more about this topic, biology and related others by exploring similar questions and additional content below.Similar questions
- 12. Calculate the area of a circle which has a radius of 1200 μm. Give your answer in mm² in scientific notation with the correct number of significant figures.arrow_forwardDescribe the image quality of the B.megaterium at 1000X before adding oil? What does adding oil do to the quality of the image?arrow_forwardWhich of the follwowing cells from this lab do you expect to have a nucleus and why or why not? Ceratium, Bacillus megaterium and Cheek epithelial cells?arrow_forward
- 14. If you determine there to be debris on your ocular lens, explain what is the best way to clean it off without damaging the lens?arrow_forward11. Write a simple formula for converting mm to μm when the number of mm's is known. Use the variable X to represent the number of mm's in your formula.arrow_forward13. When a smear containing cells is dried, the cells shrink due to the loss of water. What technique could you use to visualize and measure living cells without heat-fixing them? Hint: you did this technique in part I.arrow_forward
- 10. Write a simple formula for converting μm to mm when the number of μm's are known. Use the variable X to represent the number of um's in your formula.arrow_forward8. How many μm² is in one cm²; express the result in scientific notation. Show your calculations. 1 cm = 10 mm; 1 mm = 1000 μmarrow_forwardFind the dental formula and enter it in the following format: I3/3 C1/1 P4/4 M2/3 = 42 (this is not the correct number, just the correct format) Please be aware: the upper jaw is intact (all teeth are present). The bottom jaw/mandible is not intact. The front teeth should include 6 total rectangular teeth (3 on each side) and 2 total large triangular teeth (1 on each side).arrow_forward
- Answer iarrow_forwardAnswerarrow_forwardcalculate the questions showing the solution including variables,unit and equations all the questiosn below using the data a) B1, b) B2, c) hybrid rate constant (1) d) hybrid rate constant (2) e) t1/2,dist f) t1/2,elim g) k10 h) k12 i) k21 j) initial concentration (C0) k) central compartment volume (V1) l) steady-state volume (Vss) m) clearance (CL) AUC (0→10 min) using trapezoidal rule n) AUC (20→30 min) using trapezoidal rule o) AUCtail (AUC360→∞) p) total AUC (using short cut method) q) volume from AUC (VAUC)arrow_forward
arrow_back_ios
SEE MORE QUESTIONS
arrow_forward_ios
Recommended textbooks for you
 Biology: The Dynamic Science (MindTap Course List)BiologyISBN:9781305389892Author:Peter J. Russell, Paul E. Hertz, Beverly McMillanPublisher:Cengage Learning
 Human Heredity: Principles and Issues (MindTap Co...BiologyISBN:9781305251052Author:Michael CummingsPublisher:Cengage Learning
 Biology Today and Tomorrow without Physiology (Mi...BiologyISBN:9781305117396Author:Cecie Starr, Christine Evers, Lisa StarrPublisher:Cengage Learning
 Human Biology (MindTap Course List)BiologyISBN:9781305112100Author:Cecie Starr, Beverly McMillanPublisher:Cengage Learning
 Concepts of BiologyBiologyISBN:9781938168116Author:Samantha Fowler, Rebecca Roush, James WisePublisher:OpenStax College

Biology: The Dynamic Science (MindTap Course List)
Biology
ISBN:9781305389892
Author:Peter J. Russell, Paul E. Hertz, Beverly McMillan
Publisher:Cengage Learning

Human Heredity: Principles and Issues (MindTap Co...
Biology
ISBN:9781305251052
Author:Michael Cummings
Publisher:Cengage Learning

Biology Today and Tomorrow without Physiology (Mi...
Biology
ISBN:9781305117396
Author:Cecie Starr, Christine Evers, Lisa Starr
Publisher:Cengage Learning


Human Biology (MindTap Course List)
Biology
ISBN:9781305112100
Author:Cecie Starr, Beverly McMillan
Publisher:Cengage Learning

Concepts of Biology
Biology
ISBN:9781938168116
Author:Samantha Fowler, Rebecca Roush, James Wise
Publisher:OpenStax College
How to solve genetics probability problems; Author: Shomu's Biology;https://www.youtube.com/watch?v=R0yjfb1ooUs;License: Standard YouTube License, CC-BY
Beyond Mendelian Genetics: Complex Patterns of Inheritance; Author: Professor Dave Explains;https://www.youtube.com/watch?v=-EmvmBuK-B8;License: Standard YouTube License, CC-BY