
(a)
To find:
The shortage and full economic
Answer to Problem 8CACQ
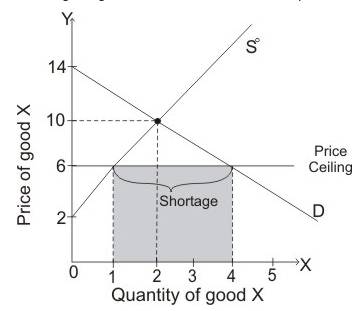
There is shortage of three units and thefull economic price is $12.
Explanation of Solution
The diagram given below shows the effect of
When
Full economic price is the total amount paid by the consumer in getting the product.
Price ceiling:
Price ceiling is the minimum price imposed by a government below which goods are supplied.
Full economic price:
Full economic price is the total amount paid by the consumer in getting the product below the imposed price ceiling.
(b)
To find:
The surplus as a result of imposition of $12 as price support and costs to the government in purchasing the units and all unsold units.
Answer to Problem 8CACQ
The costs to the government in purchasing units is $12.
Explanation of Solution
The diagram given below shows the effect of
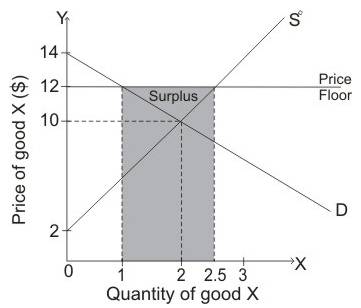
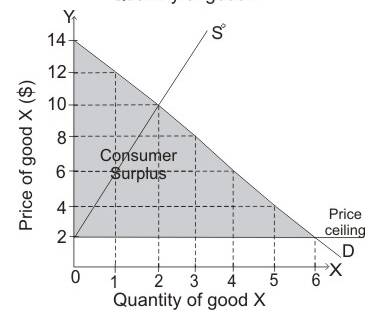
When demand curve is D and Supply curve is S0then equilibrium is attained when price of commodity is $10 and quantity demanded is 2 units. When government imposed the price floor of $12, then quantity supplied is greater than the quantity demanded so there is surplus of goods in an economy. Thus, there is surplus of 1.5units.
The shaded area in the diagram shows the surplus of good in an economy.
When price of commodity is more than the
Price floor:
Price floor is the maximum price which government has imposed above which goods are sold in the market.
(c)
To find:
The equilibrium price after excise tax of $6 is imposed, the price received by producers and the number of units that are sold.
Answer to Problem 8CACQ
The price paid by consumer is $12 per unit while the price received by the producer is $6 per unit. The number of units sold is 1 unit.
Explanation of Solution
When equilibrium price is $10 and government imposes excise tax of $6, then supply curve will shift leftwards from S0 to S1,which leads to rise in equilibrium price from $10 to $12. At equilibrium price of $12, quantity demanded is 1 unit.
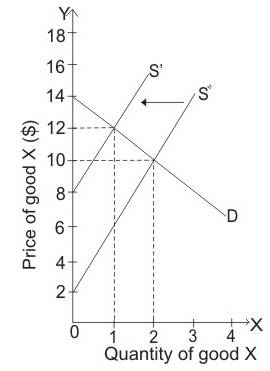
The price paid by consumer is $12 per unit while the price received by the producer is $6 per unit. The number of units sold is 1 unit.
Excise tax:
An excise tax is a tax imposed on manufacturers for producing goods.
(d)
To explain:
The level of
Answer to Problem 8CACQ
The value of
Explanation of Solution
When demand curve D and supply curve S0 intersects then equilibrium is attained at price of $10 while equilibrium quantity is attained at 2 units.
Consumer surplus is the below demand curve and above the price level $10. So, consumer’s surplus is equal to:
Thus, the value of consumer surplus is $4.
Producer surplus is the area above curve and below the price level $10. So, producer’s surplus is equal to:
Thus, the value of producer surplus is $4.
Consumer surplus:
Consumer surplus is the variance in the amount that consumers are ready to pay and the price which is actually paid by them. The area of consumer surplus is below the demand curve and above the price.
Consumer surplus:
Producer surplus is the variance in the amount at which producers accept the quantity and the amount at which they sell. Producer surplus is the area above curve and below the price level.
(e)
To explain:
Whether the price can be benefitted with the price ceiling of $2.
Explanation of Solution
When price ceiling is $2 then producers do not want to produce any commodity while consumers want to consume any commodity which is produced.
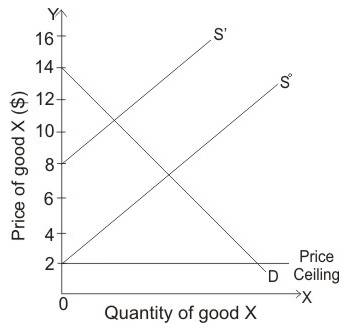
At price of $2, all consumers will benefit if producers supply commodity but at this low-price firms are not interested to produce any commodity.
Price ceiling:
Price ceiling is the maximum price imposed by a government below which goods are supplied.
Want to see more full solutions like this?
Chapter 2 Solutions
EBK MANAGERIAL ECONOMICS & BUSINESS STR

- An actuary analyzes a company’s annual personal auto claims, M and annual commercialauto claims, N . The analysis reveals that V ar(M ) = 1600, V ar(N ) = 900, and thecorrelation between M and N is ρ = 0.64. Compute V ar(M + N ).arrow_forwardDon't used hand raitingarrow_forwardAnswer in step by step with explanation. Don't use Ai.arrow_forward
- Use the figure below to answer the following question. Let I represent Income when healthy, let I represent income when ill. Let E [I] represent expected income for a given probability (p) of falling ill. Utility у в ULI income Is есте IM The actuarially fair & partial contract is represented by Point X × OB A Yarrow_forwardSuppose that there is a 25% chance Riju is injured and earns $180,000, and a 75% chance she stays healthy and will earn $900,000. Suppose further that her utility function is the following: U = (Income) ³. Riju's utility if she earns $180,000 is _ and her utility if she earns $900,000 is. X 56.46; 169.38 56.46; 96.55 96.55; 56.46 40.00; 200.00 169.38; 56.46arrow_forwardUse the figure below to answer the following question. Let là represent Income when healthy, let Is represent income when ill. Let E[I], represent expected income for a given probability (p) of falling ill. Utility & B естве IH S Point D represents ☑ actuarially fair & full contract actuarially fair & partial contract O actuarially unfair & full contract uninsurance incomearrow_forward
- Suppose that there is a 25% chance Riju is injured and earns $180,000, and a 75% chance she stays healthy and will earn $900,000. Suppose further that her utility function is the following: U = (Income). Riju is risk. She will prefer (given the same expected income). averse; no insurance to actuarially fair and full insurance lover; actuarially fair and full insurance to no insurance averse; actuarially fair and full insurance to no insurance neutral; he will be indifferent between actuarially fair and full insurance to no insurance lover; no insurance to actuarially fair and full insurancearrow_forward19. (20 points in total) Suppose that the market demand curve is p = 80 - 8Qd, where p is the price per unit and Qd is the number of units demanded per week, and the market supply curve is p = 5+7Qs, where Q5 is the quantity supplied per week. a. b. C. d. e. Calculate the equilibrium price and quantity for a competitive market in which there is no market failure. Draw a diagram that includes the demand and supply curves, the values of the vertical- axis intercepts, and the competitive equilibrium quantity and price. Label the curves, axes and areas. Calculate both the marginal willingness to pay and the total willingness to pay for the equilibrium quantity. Calculate both the marginal cost of the equilibrium quantity and variable cost of producing the equilibrium quantity. Calculate the total surplus. How is the value of total surplus related to your calculations in parts c and d?arrow_forwardPlease answer all parts of the questionarrow_forward
- Don't use ai to answer I will report you answerarrow_forwardWhat is a multi domain strategy in SEO? How does it work?arrow_forwardSam's profit is maximized when he produces shirts. When he does this, the marginal cost of the last shirt he produces is , which is than the price Sam receives for each shirt he sells. The marginal cost of producing an additional shirt (that is, one more shirt than would maximize his profit) is , which is than the price Sam receives for each shirt he sells. Therefore, Sam's profit-maximizing quantity corresponds to the intersection of the curves. Because Sam is a price taker, this last condition can also be written as .arrow_forward
 Managerial Economics: Applications, Strategies an...EconomicsISBN:9781305506381Author:James R. McGuigan, R. Charles Moyer, Frederick H.deB. HarrisPublisher:Cengage Learning
 Survey of Economics (MindTap Course List)EconomicsISBN:9781305260948Author:Irvin B. TuckerPublisher:Cengage Learning


