
Introductory Statistics
3rd Edition
ISBN: 9780135188927
Author: Gould, Robert, Ryan, Colleen N. (colleen Nooter)
Publisher: Pearson,
expand_more
expand_more
format_list_bulleted
Concept explainers
Videos
Textbook Question
Chapter 2, Problem 48SE
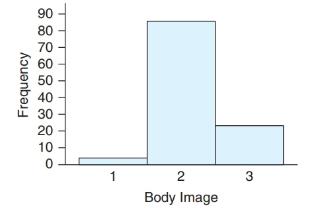
Body Image A student has gathered data on self-perceived body image, where 1 represents “underweight,” 2 represents “about right,” and 3 represents “overweight.” A graph of these data is shown. What type of graph would be a better choice to display these data, and why?
Expert Solution & Answer
Want to see the full answer?
Check out a sample textbook solution
Students have asked these similar questions
Pam, Rob and Sam get a cake that is one-third chocolate, one-third vanilla, and one-third strawberry as shown below. They wish to fairly divide the cake using the lone chooser method. Pam likes strawberry twice as much as chocolate or vanilla. Rob only likes chocolate. Sam, the chooser, likes vanilla and strawberry twice as much as chocolate. In the first division, Pam cuts the strawberry piece off and lets Rob choose his favorite piece. Based on that, Rob chooses the chocolate and vanilla parts. Note: All cuts made to the cake shown below are vertical.Which is a second division that Rob would make of his share of the cake?
Three players (one divider and two choosers) are going to divide a cake fairly using the lone divider method. The divider cuts the cake into three slices (s1, s2, and s3).
If the choosers' declarations are Chooser 1: {s1 , s2} and Chooser 2: {s2 , s3}.
Using the lone-divider method, how many different fair divisions of this cake are possible?
Theorem 2.6 (The Minkowski inequality)
Let p≥1. Suppose that X and Y are random variables, such that E|X|P <∞ and
E|Y P <00. Then
X+YpX+Yp
Chapter 2 Solutions
Introductory Statistics
Ch. 2 - Pulse Rates The dotplot shown is for resting pulse...Ch. 2 - Glucose A dotplot of the glucose readings from 132...Ch. 2 - Pulse Rates The histogram shown is for pulse rates...Ch. 2 - Fast Food Calories The histogram shown is for...Ch. 2 - Pulse Rates (Example 1) The resting pulse rates...Ch. 2 - Post Office Customers A post office branch...Ch. 2 - Cereals The following dotplots show the number of...Ch. 2 - Coins’ Weights The weights of coins (in grams)...Ch. 2 - Sleep (Example 2) An instructor asks a class of...Ch. 2 - Parking Tickets A group of 80 drivers in a large...
Ch. 2 - Arm spans (Example 3) According to the ancient...Ch. 2 - Tuition The distribution of in-state annual...Ch. 2 - Pulse Rates (Example 4) From the histogram in...Ch. 2 - Fast Food Calories From the histogram shown in...Ch. 2 - BMI (Example 5) The histograms show the Body Mass...Ch. 2 - Triglycerides The histograms show triglyceride...Ch. 2 - Education (Example 6) In 2012, the General Social...Ch. 2 - Siblings The histogram shows the distribution of...Ch. 2 - Monthly Car Costs The histograms show the monthly...Ch. 2 - Car MPG The histograms show the miles per gallon...Ch. 2 - Matching Histograms Match each of the three...Ch. 2 - Matching Match each histogram given with the...Ch. 2 - Matching Match each description with the correct...Ch. 2 - Matching Match each description with the correct...Ch. 2 - Comparing Weights of Olympic Hockey and Soccer...Ch. 2 - Rents in San Francisco The data show monthly rents...Ch. 2 - Textbook Prices The table shows prices of 50...Ch. 2 - SAT scores The following table shows a random...Ch. 2 - Animal Longevity The following table in Exercise...Ch. 2 - Animal Gestation Periods The accompanying table...Ch. 2 - Tax Rate A StatCrunch survey asked people what...Ch. 2 - Pets A StatCrunch survey asked people whether they...Ch. 2 - Law School Tuition Data are shown for the cost of...Ch. 2 - Text Messages Recently, 115 users of StatCrunch...Ch. 2 - Beer, Calories Data are available on the number of...Ch. 2 - Beer, Alcohol Data are available on the percent...Ch. 2 - Changing Multiple-Choice Answers When Told Not to...Ch. 2 - Preventable Deaths According to the World Health...Ch. 2 - Ice Cream Preference (Example 8) Suppose a group...Ch. 2 - Prob. 40SECh. 2 - Gun Availability Pew Research conducted a survey...Ch. 2 - Entry-Level Education The Bureau of Labor...Ch. 2 - Obesity Among Adults (Example 9) Data on obesity...Ch. 2 - Fitness Among Adults Data on the percentage of...Ch. 2 - Internet Browsers The following table gives the...Ch. 2 - Commercial Radio The following table gives the...Ch. 2 - Garage The accompanying graph shows the...Ch. 2 - Body Image A student has gathered data on...Ch. 2 - Pie Chart of Sleep Hours The pie chart reports the...Ch. 2 - Age and Gender The following graph shows the ages...Ch. 2 - Musicians Survey: StatCrunch Graph The...Ch. 2 - Cell Phone Use Refer to the accompanying bar...Ch. 2 - Sleep The following table shows the first few...Ch. 2 - Majors The following table shows the first few...Ch. 2 - Hormone Replacement Therapy The use of the drug...Ch. 2 - E-Music The bar graph shows information reported...Ch. 2 - Hormone Replacement Therapy Again The following...Ch. 2 - Holding Your Breath A group of students held their...Ch. 2 - Global Temperatures The histograms show the...Ch. 2 - Employment after Law School Accredited law schools...Ch. 2 - Opinions on Nuclear Energy People were asked...Ch. 2 - Stem Cell Research People were asked whether they...Ch. 2 - Create a dotplot that has at least 10 observations...Ch. 2 - Create a dotplot that has at least 10 observations...Ch. 2 - Traffic Cameras College students Jeannette Mujica,...Ch. 2 - Ideal Weight Thirty-nine students (26 women and 13...Ch. 2 - MPH The graphs show the distribution of...Ch. 2 - Shoe Sizes The graph shows shoe sizes for men and...Ch. 2 - CEO Salaries Predict the shape of the distribution...Ch. 2 - Cigarettes A physician asks all of his patients to...Ch. 2 - Changing Multiple-Choice Answers When Told to Do...Ch. 2 - ER Visits for Injuries The graph shows the rates...Ch. 2 - Social Media Use The Pew Research Center documents...Ch. 2 - Social Media Use The Pew Research Center gathered...Ch. 2 - Choosing a Graph For each situation, describe the...Ch. 2 - Choosing a Graph For each situation, describe the...
Additional Math Textbook Solutions
Find more solutions based on key concepts
For Problems 23-28, write in simpler form, as in Example 4. logbFG
Finite Mathematics for Business, Economics, Life Sciences and Social Sciences
1. How is a sample related to a population?
Elementary Statistics: Picturing the World (7th Edition)
23. A plant nursery sells two sizes of oak trees to landscapers. Large trees cost the nursery $120 from the gro...
College Algebra (Collegiate Math)
Provide an example of a qualitative variable and an example of a quantitative variable.
Elementary Statistics ( 3rd International Edition ) Isbn:9781260092561
Evaluate the integrals in Exercises 1–46.
1.
University Calculus: Early Transcendentals (4th Edition)
(a) Make a stem-and-leaf plot for these 24 observations on the number of customers who used a down-town CitiBan...
APPLIED STAT.IN BUS.+ECONOMICS
Knowledge Booster


Learn more about
Need a deep-dive on the concept behind this application? Look no further. Learn more about this topic, statistics and related others by exploring similar questions and additional content below.Similar questions
- Theorem 1.2 (1) Suppose that P(|X|≤b) = 1 for some b > 0, that EX = 0, and set Var X = 0². Then, for 0 0, P(X > x) ≤e-x+1²² P(|X|>x) ≤2e-1x+1²² (ii) Let X1, X2...., Xn be independent random variables with mean 0, suppose that P(X ≤b) = 1 for all k, and set oσ = Var X. Then, for x > 0. and 0x) ≤2 exp Σ k=1 (iii) If, in addition, X1, X2, X, are identically distributed, then P(S|x) ≤2 expl-tx+nt²o).arrow_forwardTheorem 5.1 (Jensen's inequality) state without proof the Jensen's Ineg. Let X be a random variable, g a convex function, and suppose that X and g(X) are integrable. Then g(EX) < Eg(X).arrow_forwardCan social media mistakes hurt your chances of finding a job? According to a survey of 1,000 hiring managers across many different industries, 76% claim that they use social media sites to research prospective candidates for any job. Calculate the probabilities of the following events. (Round your answers to three decimal places.) answer parts a-c. a) Out of 30 job listings, at least 19 will conduct social media screening. b) Out of 30 job listings, fewer than 17 will conduct social media screening. c) Out of 30 job listings, exactly between 19 and 22 (including 19 and 22) will conduct social media screening. show all steps for probabilities please. answer parts a-c.arrow_forward
- Question: we know that for rt. (x+ys s ا. 13. rs. and my so using this, show that it vye and EIXI, EIYO This : E (IX + Y) ≤2" (EIX (" + Ely!")arrow_forwardTheorem 2.4 (The Hölder inequality) Let p+q=1. If E|X|P < ∞ and E|Y| < ∞, then . |EXY ≤ E|XY|||X|| ||||qarrow_forwardTheorem 7.6 (Etemadi's inequality) Let X1, X2, X, be independent random variables. Then, for all x > 0, P(max |S|>3x) ≤3 max P(S| > x). Isk≤narrow_forward
- Theorem 7.2 Suppose that E X = 0 for all k, that Var X = 0} x) ≤ 2P(S>x 1≤k≤n S√2), -S√2). P(max Sk>x) ≤ 2P(|S|>x- 1arrow_forwardThree players (one divider and two choosers) are going to divide a cake fairly using the lone divider method. The divider cuts the cake into three slices (s1, s2, and s3).If the chooser's declarations are Chooser 1: {s3} and Chooser 2: {s3}, which of the following is a fair division of the cake?arrow_forwardTheorem 1.4 (Chebyshev's inequality) (i) Suppose that Var X x)≤- x > 0. 2 (ii) If X1, X2,..., X, are independent with mean 0 and finite variances, then Στη Var Xe P(|Sn| > x)≤ x > 0. (iii) If, in addition, X1, X2, Xn are identically distributed, then nVar Xi P(|Sn> x) ≤ x > 0. x²arrow_forwardTheorem 2.5 (The Lyapounov inequality) For 0arrow_forwardTheorem 1.6 (The Kolmogorov inequality) Let X1, X2, Xn be independent random variables with mean 0 and suppose that Var Xk 0, P(max Sk>x) ≤ Isk≤n Σ-Var X In particular, if X1, X2,..., X, are identically distributed, then P(max Sx) ≤ Isk≤n nVar X₁ x2arrow_forwardTheorem 3.1 (The Cauchy-Schwarz inequality) Suppose that X and Y have finite variances. Then |EXYarrow_forwardarrow_back_iosSEE MORE QUESTIONSarrow_forward_iosRecommended textbooks for you
 Big Ideas Math A Bridge To Success Algebra 1: Stu...AlgebraISBN:9781680331141Author:HOUGHTON MIFFLIN HARCOURTPublisher:Houghton Mifflin Harcourt
 Glencoe Algebra 1, Student Edition, 9780079039897...AlgebraISBN:9780079039897Author:CarterPublisher:McGraw Hill
 Holt Mcdougal Larson Pre-algebra: Student Edition...AlgebraISBN:9780547587776Author:HOLT MCDOUGALPublisher:HOLT MCDOUGAL
 Functions and Change: A Modeling Approach to Coll...AlgebraISBN:9781337111348Author:Bruce Crauder, Benny Evans, Alan NoellPublisher:Cengage Learning
 Algebra: Structure And Method, Book 1AlgebraISBN:9780395977224Author:Richard G. Brown, Mary P. Dolciani, Robert H. Sorgenfrey, William L. ColePublisher:McDougal Littell
Big Ideas Math A Bridge To Success Algebra 1: Stu...AlgebraISBN:9781680331141Author:HOUGHTON MIFFLIN HARCOURTPublisher:Houghton Mifflin HarcourtGlencoe Algebra 1, Student Edition, 9780079039897...AlgebraISBN:9780079039897Author:CarterPublisher:McGraw HillHolt Mcdougal Larson Pre-algebra: Student Edition...AlgebraISBN:9780547587776Author:HOLT MCDOUGALPublisher:HOLT MCDOUGALFunctions and Change: A Modeling Approach to Coll...AlgebraISBN:9781337111348Author:Bruce Crauder, Benny Evans, Alan NoellPublisher:Cengage LearningAlgebra: Structure And Method, Book 1AlgebraISBN:9780395977224Author:Richard G. Brown, Mary P. Dolciani, Robert H. Sorgenfrey, William L. ColePublisher:McDougal LittellWhich is the best chart: Selecting among 14 types of charts Part II; Author: 365 Data Science;https://www.youtube.com/watch?v=qGaIB-bRn-A;License: Standard YouTube License, CC-BY