
Introductory Statistics
3rd Edition
ISBN: 9780135188927
Author: Gould, Robert, Ryan, Colleen N. (colleen Nooter)
Publisher: Pearson,
expand_more
expand_more
format_list_bulleted
Concept explainers
Videos
Textbook Question
Chapter 2, Problem 57CRE
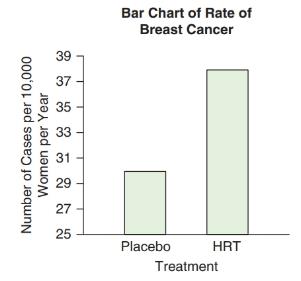
Hormone Replacement Therapy Again The following bar chart shows a comparison of breast cancer rates for those who took HRT and those who took a placebo. Explain why the graph is deceptive, and indicate what could be done to make it less so.
Expert Solution & Answer
Want to see the full answer?
Check out a sample textbook solution
Students have asked these similar questions
The following data represent total ventilation measured in liters of air per minute per square meter of body area for two independent (and randomly chosen) samples.
Analyze these data using the appropriate non-parametric hypothesis test
each column represents before & after measurements on the same individual. Analyze with the appropriate non-parametric hypothesis test for a paired design.
Should you be confident in applying your regression equation to estimate the heart rate of a python at 35°C? Why or why not?
Chapter 2 Solutions
Introductory Statistics
Ch. 2 - Pulse Rates The dotplot shown is for resting pulse...Ch. 2 - Glucose A dotplot of the glucose readings from 132...Ch. 2 - Pulse Rates The histogram shown is for pulse rates...Ch. 2 - Fast Food Calories The histogram shown is for...Ch. 2 - Pulse Rates (Example 1) The resting pulse rates...Ch. 2 - Post Office Customers A post office branch...Ch. 2 - Cereals The following dotplots show the number of...Ch. 2 - Coins’ Weights The weights of coins (in grams)...Ch. 2 - Sleep (Example 2) An instructor asks a class of...Ch. 2 - Parking Tickets A group of 80 drivers in a large...
Ch. 2 - Arm spans (Example 3) According to the ancient...Ch. 2 - Tuition The distribution of in-state annual...Ch. 2 - Pulse Rates (Example 4) From the histogram in...Ch. 2 - Fast Food Calories From the histogram shown in...Ch. 2 - BMI (Example 5) The histograms show the Body Mass...Ch. 2 - Triglycerides The histograms show triglyceride...Ch. 2 - Education (Example 6) In 2012, the General Social...Ch. 2 - Siblings The histogram shows the distribution of...Ch. 2 - Monthly Car Costs The histograms show the monthly...Ch. 2 - Car MPG The histograms show the miles per gallon...Ch. 2 - Matching Histograms Match each of the three...Ch. 2 - Matching Match each histogram given with the...Ch. 2 - Matching Match each description with the correct...Ch. 2 - Matching Match each description with the correct...Ch. 2 - Comparing Weights of Olympic Hockey and Soccer...Ch. 2 - Rents in San Francisco The data show monthly rents...Ch. 2 - Textbook Prices The table shows prices of 50...Ch. 2 - SAT scores The following table shows a random...Ch. 2 - Animal Longevity The following table in Exercise...Ch. 2 - Animal Gestation Periods The accompanying table...Ch. 2 - Tax Rate A StatCrunch survey asked people what...Ch. 2 - Pets A StatCrunch survey asked people whether they...Ch. 2 - Law School Tuition Data are shown for the cost of...Ch. 2 - Text Messages Recently, 115 users of StatCrunch...Ch. 2 - Beer, Calories Data are available on the number of...Ch. 2 - Beer, Alcohol Data are available on the percent...Ch. 2 - Changing Multiple-Choice Answers When Told Not to...Ch. 2 - Preventable Deaths According to the World Health...Ch. 2 - Ice Cream Preference (Example 8) Suppose a group...Ch. 2 - Prob. 40SECh. 2 - Gun Availability Pew Research conducted a survey...Ch. 2 - Entry-Level Education The Bureau of Labor...Ch. 2 - Obesity Among Adults (Example 9) Data on obesity...Ch. 2 - Fitness Among Adults Data on the percentage of...Ch. 2 - Internet Browsers The following table gives the...Ch. 2 - Commercial Radio The following table gives the...Ch. 2 - Garage The accompanying graph shows the...Ch. 2 - Body Image A student has gathered data on...Ch. 2 - Pie Chart of Sleep Hours The pie chart reports the...Ch. 2 - Age and Gender The following graph shows the ages...Ch. 2 - Musicians Survey: StatCrunch Graph The...Ch. 2 - Cell Phone Use Refer to the accompanying bar...Ch. 2 - Sleep The following table shows the first few...Ch. 2 - Majors The following table shows the first few...Ch. 2 - Hormone Replacement Therapy The use of the drug...Ch. 2 - E-Music The bar graph shows information reported...Ch. 2 - Hormone Replacement Therapy Again The following...Ch. 2 - Holding Your Breath A group of students held their...Ch. 2 - Global Temperatures The histograms show the...Ch. 2 - Employment after Law School Accredited law schools...Ch. 2 - Opinions on Nuclear Energy People were asked...Ch. 2 - Stem Cell Research People were asked whether they...Ch. 2 - Create a dotplot that has at least 10 observations...Ch. 2 - Create a dotplot that has at least 10 observations...Ch. 2 - Traffic Cameras College students Jeannette Mujica,...Ch. 2 - Ideal Weight Thirty-nine students (26 women and 13...Ch. 2 - MPH The graphs show the distribution of...Ch. 2 - Shoe Sizes The graph shows shoe sizes for men and...Ch. 2 - CEO Salaries Predict the shape of the distribution...Ch. 2 - Cigarettes A physician asks all of his patients to...Ch. 2 - Changing Multiple-Choice Answers When Told to Do...Ch. 2 - ER Visits for Injuries The graph shows the rates...Ch. 2 - Social Media Use The Pew Research Center documents...Ch. 2 - Social Media Use The Pew Research Center gathered...Ch. 2 - Choosing a Graph For each situation, describe the...Ch. 2 - Choosing a Graph For each situation, describe the...
Additional Math Textbook Solutions
Find more solutions based on key concepts
The largest polynomial that divides evenly into a list of polynomials is called the _______.
Elementary & Intermediate Algebra
1. How much money is Joe earning when he’s 30?
Pathways To Math Literacy (looseleaf)
Reading, Writing, and Rounding Whole Numbers Write in words. 357
Mathematics for the Trades: A Guided Approach (11th Edition) (What's New in Trade Math)
(a) Make a stem-and-leaf plot for these 24 observations on the number of customers who used a down-town CitiBan...
APPLIED STAT.IN BUS.+ECONOMICS
153. A rain gutter is made from sheets of aluminum that are 20 inches wide. As shown in the figure, the edges ...
College Algebra (7th Edition)
Provide an example of a qualitative variable and an example of a quantitative variable.
Elementary Statistics ( 3rd International Edition ) Isbn:9781260092561
Knowledge Booster


Learn more about
Need a deep-dive on the concept behind this application? Look no further. Learn more about this topic, statistics and related others by exploring similar questions and additional content below.Similar questions
- Given your fitted regression line, what would be the residual for snake #5 (10 C)?arrow_forwardCalculate the 95% confidence interval around your estimate of r using Fisher’s z-transformation. In your final answer, make sure to back-transform to the original units.arrow_forwardCalculate Pearson’s correlation coefficient (r) between temperature and heart rate.arrow_forward
- A researcher wishes to estimate, with 90% confidence, the population proportion of adults who support labeling legislation for genetically modified organisms (GMOs). Her estimate must be accurate within 4% of the true proportion. (a) No preliminary estimate is available. Find the minimum sample size needed. (b) Find the minimum sample size needed, using a prior study that found that 65% of the respondents said they support labeling legislation for GMOs. (c) Compare the results from parts (a) and (b). ... (a) What is the minimum sample size needed assuming that no prior information is available? n = (Round up to the nearest whole number as needed.)arrow_forwardThe table available below shows the costs per mile (in cents) for a sample of automobiles. At a = 0.05, can you conclude that at least one mean cost per mile is different from the others? Click on the icon to view the data table. Let Hss, HMS, HLS, Hsuv and Hмy represent the mean costs per mile for small sedans, medium sedans, large sedans, SUV 4WDs, and minivans respectively. What are the hypotheses for this test? OA. Ho: Not all the means are equal. Ha Hss HMS HLS HSUV HMV B. Ho Hss HMS HLS HSUV = μMV Ha: Hss *HMS *HLS*HSUV * HMV C. Ho Hss HMS HLS HSUV =μMV = = H: Not all the means are equal. D. Ho Hss HMS HLS HSUV HMV Ha Hss HMS HLS =HSUV = HMVarrow_forwardQuestion: A company launches two different marketing campaigns to promote the same product in two different regions. After one month, the company collects the sales data (in units sold) from both regions to compare the effectiveness of the campaigns. The company wants to determine whether there is a significant difference in the mean sales between the two regions. Perform a two sample T-test You can provide your answer by inserting a text box and the answer must include: Null hypothesis, Alternative hypothesis, Show answer (output table/summary table), and Conclusion based on the P value. (2 points = 0.5 x 4 Answers) Each of these is worth 0.5 points. However, showing the calculation is must. If calculation is missing, the whole answer won't get any credit.arrow_forward
arrow_back_ios
SEE MORE QUESTIONS
arrow_forward_ios
Recommended textbooks for you
 Glencoe Algebra 1, Student Edition, 9780079039897...AlgebraISBN:9780079039897Author:CarterPublisher:McGraw Hill
 Holt Mcdougal Larson Pre-algebra: Student Edition...AlgebraISBN:9780547587776Author:HOLT MCDOUGALPublisher:HOLT MCDOUGAL
 Big Ideas Math A Bridge To Success Algebra 1: Stu...AlgebraISBN:9781680331141Author:HOUGHTON MIFFLIN HARCOURTPublisher:Houghton Mifflin Harcourt
 College Algebra (MindTap Course List)AlgebraISBN:9781305652231Author:R. David Gustafson, Jeff HughesPublisher:Cengage Learning
Glencoe Algebra 1, Student Edition, 9780079039897...
Algebra
ISBN:9780079039897
Author:Carter
Publisher:McGraw Hill
Holt Mcdougal Larson Pre-algebra: Student Edition...
Algebra
ISBN:9780547587776
Author:HOLT MCDOUGAL
Publisher:HOLT MCDOUGAL
Big Ideas Math A Bridge To Success Algebra 1: Stu...
Algebra
ISBN:9781680331141
Author:HOUGHTON MIFFLIN HARCOURT
Publisher:Houghton Mifflin Harcourt
College Algebra (MindTap Course List)
Algebra
ISBN:9781305652231
Author:R. David Gustafson, Jeff Hughes
Publisher:Cengage Learning
Correlation Vs Regression: Difference Between them with definition & Comparison Chart; Author: Key Differences;https://www.youtube.com/watch?v=Ou2QGSJVd0U;License: Standard YouTube License, CC-BY
Correlation and Regression: Concepts with Illustrative examples; Author: LEARN & APPLY : Lean and Six Sigma;https://www.youtube.com/watch?v=xTpHD5WLuoA;License: Standard YouTube License, CC-BY