
EBK STATISTICS FOR BUSINESS & ECONOMICS
12th Edition
ISBN: 8220100460463
Author: Anderson
Publisher: CENGAGE L
expand_more
expand_more
format_list_bulleted
Concept explainers
Videos
Textbook Question
Chapter 2, Problem 45SE
The Pittsburgh Steelers defeated the Arizona Cardinals 27 to 23 in professional football’s 43rd Super Bowl. With this win, its sixth championship, the Pittsburgh Steelers became the team with the most wins in the 43-year history of the
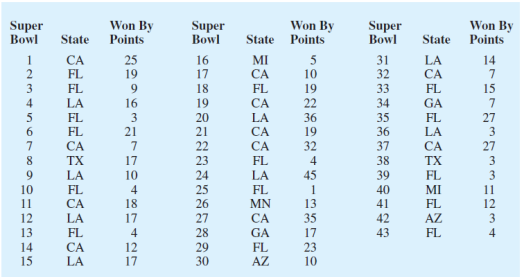
2009). The Super Bowl has been played in eight different states: Arizona (AZ), California (CA), Florida (FL), Georgia (GA), Louisiana (LA), Michigan (MI), Minnesota (MN), and Texas (TX). Data in the following table show the state where the Super Bowls were played and the point margin of victory for the winning team.
- a. Show a frequency distribution and bar chart for the state where the Super Bowl was played.
- b. What conclusions can you draw from your summary in part (a)? What percentage of Super Bowls were played in the states of Florida or California? What percentage of Super Bowls were played in northern or cold-weather states?
- c. Show a stretched stem-and-leaf display for the point margin of victory for the winning team. Show a histogram.
- d. What conclusions can you draw from your summary in part (c)? What percentage of Super Bowls have been close games with the margin of victory less than 5 points? What percentage of Super Bowls have been won by 20 or more points?
- e. The closest Super Bowl occurred when the New York Giants beat the Buffalo Bills. Where was this game played and what was the winning margin of victory? The biggest point margin in Super Bowl history occurred when the San Francisco 49ers beat the Denver Broncos. Where was this game played and what was the winning margin of victory?
Expert Solution & Answer

Trending nowThis is a popular solution!

Students have asked these similar questions
3. Please
What does the margin of error include? When a margin of error is reported for a survey, it includes
a. random sampling error and other practical difficulties like undercoverage and non-response
b. random sampling error, but not other practical difficulties like undercoverage and nonresponse
c. practical difficulties like undercoverage and nonresponse, but not random smapling error
d. none of the above is corret
solve part a on paper
Chapter 2 Solutions
EBK STATISTICS FOR BUSINESS & ECONOMICS
Ch. 2.1 - Methods 1. The response to a question has three...Ch. 2.1 - A partial relative frequency distribution is...Ch. 2.1 - A questionnaire provides 58 Yes, 42 No, and 20...Ch. 2.1 - for the 20102011 viewing season, the top five...Ch. 2.1 - In alphabetical order, the six most common last...Ch. 2.1 - Nielsen Media Research provided the list of the 25...Ch. 2.1 - The Canmark Research Center Airport Customer...Ch. 2.1 - Data for a sample of 55 members of the Baseball...Ch. 2.1 - The Pew Research Centers Social Demographic...Ch. 2.1 - The Financial Times/Harris Poll is a monthly...
Ch. 2.2 - Consider the following data. a. Develop a...Ch. 2.2 - Consider the following frequency distribution....Ch. 2.2 - Construct a histogram for the data in exercise 12.Ch. 2.2 - Consider the following data. a. Construct a dot...Ch. 2.2 - Construct a stem-and-leaf display for the...Ch. 2.2 - Construct a stem-and-leaf display for the...Ch. 2.2 - Applications A doctors office staff studied the...Ch. 2.2 - A shortage of candidates has required school...Ch. 2.2 - The London School of Economics and the Harvard...Ch. 2.2 - Fortune provides a list of Americas largest...Ch. 2.2 - entrepreneur magazine ranks franchises using...Ch. 2.2 - The Nielsen Home Technology Report provided...Ch. 2.2 - Prob. 24ECh. 2.2 - A psychologist developed a new test of adult...Ch. 2.2 - The 2011 Cincinnati Flying Pig Half-Marathon (13.1...Ch. 2.3 - The following data are for 30 observations...Ch. 2.3 - The following observations are for two...Ch. 2.3 - The following crosstabulation shows household...Ch. 2.3 - Refer again to the crosstabulation of household...Ch. 2.3 - Recently, management at Oak Tree Golf Course...Ch. 2.3 - Table 2.12 shows a data set containing information...Ch. 2.3 - Refer to the data in Table 2.12. a. Prepare a...Ch. 2.3 - Refer to the data in Table 2.12. a. Prepare a...Ch. 2.3 - The U.S. Department of Energys Fuel Economy Guide...Ch. 2.4 - The following 20 observations are for two...Ch. 2.4 - Consider the following data on two categorical...Ch. 2.4 - The following crosstabulation summarizes the data...Ch. 2.4 - A study on driving speed (miles per hour) and fuel...Ch. 2.4 - The Current Results website lists the average...Ch. 2.4 - People often wait until middle age to worry about...Ch. 2.4 - Smartphones are advanced mobile phones with...Ch. 2.4 - The Northwest regional manager of an outdoor...Ch. 2 - Approximately 1.5 million high school students...Ch. 2 - The Pittsburgh Steelers defeated the Arizona...Ch. 2 - Data showing the population by state in millions...Ch. 2 - A startup companys ability to gain funding is a...Ch. 2 - Consumer complaints are frequently reported to the...Ch. 2 - Dividend yield is the annual dividend paid by a...Ch. 2 - One of the questions in a Financial Times/Harris...Ch. 2 - western University has only one womens softball...Ch. 2 - A survey of commercial buildings served by the...Ch. 2 - Table 2.18 shows a portion of the data for a...Ch. 2 - Refer to the data set in Table 2.18. a. Construct...Ch. 2 - Refer to the data set in Table 2.18. a. Construct...Ch. 2 - Refer to the data set in Table 2.18. a. Prepare a...Ch. 2 - Google has changed its strategy with regard to how...Ch. 2 - A zoo has categorized its visitors into three...Ch. 2 - Pelican Stores Pelican Stores, a division of...Ch. 2 - Motion Picture Industry The motion picture...
Knowledge Booster


Learn more about
Need a deep-dive on the concept behind this application? Look no further. Learn more about this topic, statistics and related others by exploring similar questions and additional content below.Similar questions
- T1.4: Let ẞ(G) be the minimum size of a vertex cover, a(G) be the maximum size of an independent set and m(G) = |E(G)|. (i) Prove that if G is triangle free (no induced K3) then m(G) ≤ a(G)B(G). Hints - The neighborhood of a vertex in a triangle free graph must be independent; all edges have at least one end in a vertex cover. (ii) Show that all graphs of order n ≥ 3 and size m> [n2/4] contain a triangle. Hints - you may need to use either elementary calculus or the arithmetic-geometric mean inequality.arrow_forwardWe consider the one-period model studied in class as an example. Namely, we assumethat the current stock price is S0 = 10. At time T, the stock has either moved up toSt = 12 (with probability p = 0.6) or down towards St = 8 (with probability 1−p = 0.4).We consider a call option on this stock with maturity T and strike price K = 10. Theinterest rate on the money market is zero.As in class, we assume that you, as a customer, are willing to buy the call option on100 shares of stock for $120. The investor, who sold you the option, can adopt one of thefollowing strategies: Strategy 1: (seen in class) Buy 50 shares of stock and borrow $380. Strategy 2: Buy 55 shares of stock and borrow $430. Strategy 3: Buy 60 shares of stock and borrow $480. Strategy 4: Buy 40 shares of stock and borrow $280.(a) For each of strategies 2-4, describe the value of the investor’s portfolio at time 0,and at time T for each possible movement of the stock.(b) For each of strategies 2-4, does the investor have…arrow_forwardNegate the following compound statement using De Morgans's laws.arrow_forward
- Negate the following compound statement using De Morgans's laws.arrow_forwardQuestion 6: Negate the following compound statements, using De Morgan's laws. A) If Alberta was under water entirely then there should be no fossil of mammals.arrow_forwardNegate the following compound statement using De Morgans's laws.arrow_forward
- Characterize (with proof) all connected graphs that contain no even cycles in terms oftheir blocks.arrow_forwardLet G be a connected graph that does not have P4 or C3 as an induced subgraph (i.e.,G is P4, C3 free). Prove that G is a complete bipartite grapharrow_forwardProve sufficiency of the condition for a graph to be bipartite that is, prove that if G hasno odd cycles then G is bipartite as follows:Assume that the statement is false and that G is an edge minimal counterexample. That is, Gsatisfies the conditions and is not bipartite but G − e is bipartite for any edge e. (Note thatthis is essentially induction, just using different terminology.) What does minimality say aboutconnectivity of G? Can G − e be disconnected? Explain why if there is an edge between twovertices in the same part of a bipartition of G − e then there is an odd cyclearrow_forward
arrow_back_ios
SEE MORE QUESTIONS
arrow_forward_ios
Recommended textbooks for you

 College Algebra (MindTap Course List)AlgebraISBN:9781305652231Author:R. David Gustafson, Jeff HughesPublisher:Cengage Learning
College Algebra (MindTap Course List)
Algebra
ISBN:9781305652231
Author:R. David Gustafson, Jeff Hughes
Publisher:Cengage Learning
Find number of persons in a part with 66 handshakes Combinations; Author: Anil Kumar;https://www.youtube.com/watch?v=33TgLi-wp3E;License: Standard YouTube License, CC-BY
Discrete Math 6.3.1 Permutations and Combinations; Author: Kimberly Brehm;https://www.youtube.com/watch?v=J1m9sB5XZQc;License: Standard YouTube License, CC-BY
How to use permutations and combinations; Author: Mario's Math Tutoring;https://www.youtube.com/watch?v=NEGxh_D7yKU;License: Standard YouTube License, CC-BY
Permutations and Combinations | Counting | Don't Memorise; Author: Don't Memorise;https://www.youtube.com/watch?v=0NAASclUm4k;License: Standard Youtube License
Permutations and Combinations Tutorial; Author: The Organic Chemistry Tutor;https://www.youtube.com/watch?v=XJnIdRXUi7A;License: Standard YouTube License, CC-BY