Fundamentals of Corporate Finance (4th Edition) (Berk, DeMarzo & Harford, The Corporate Finance Series)
4th Edition
ISBN: 9780134475561
Author: Jonathan Berk, Peter DeMarzo, Jarrad Harford
Publisher: PEARSON
expand_more
expand_more
format_list_bulleted
Videos
Textbook Question
Chapter 2, Problem 37P
Some
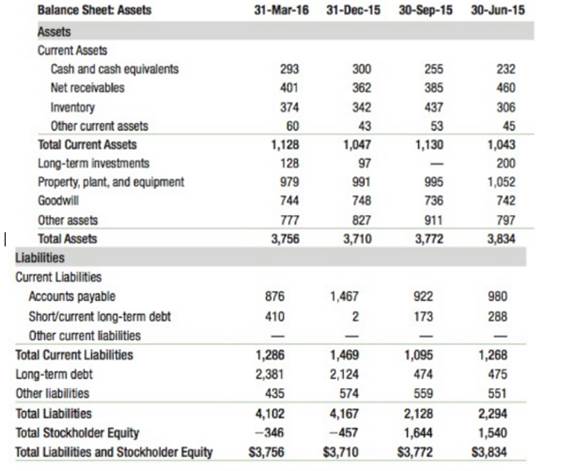
- What change in the book value of the company's equity took place at the end Of 2015?
- Is the company's market-to-book ratio meaningful? Is its book debt-equity ratiomeaningful? Explain.
- Find the company's other financial statements from that time online. What was the cause of the change to its book value of equity at the end of 2015?
- Does the company's book value of equity in 2016 imply that it is unprofitable? Explain.
Expert Solution & Answer
Want to see the full answer?
Check out a sample textbook solution
Students have asked these similar questions
One year ago, the Jenkins Family Fun Center deposited $3,700 into an investment account for the purpose of buying new equipment four years from today. Today, they
are adding another $5,500 to this account. They plan on making a final deposit of $7,700 to the account next year. How much will be available when they are ready to buy
the equipment, assuming they earn a rate of return of 9 percent?
It is anticipated that Pinnaclewalk will next pay an annual dividend of $2.2 per share in one year. The
firm's cost of equity is 19.2% and its anticipated growth rate is 3.1%. There are 420000 outstanding.
Use the Gordon Growth Model to price Pinnaclewalk's shares. {Express your answer in dollars and
cents}
What is Pinnaclewalk's market capitalization? {Express your answer in millions of dollars rounded to two
decimal places}
Thumbtack's capital structure is shown in table below. If taxes are paid annually and
Thumbtack's combined tax
rate is 36 percent, determine the weighted average cost of capital
Loans
Bonds
12%/yr/semi
$3,000,000
8%/yr/qtr
$4,500,000
Common Stock
$72/share price;
$2,000,000
$8/shr/yr dividend;
Retained Earnings
(Answer should be in %)
1%/yr share
price growth
$1,500,000
Chapter 2 Solutions
Fundamentals of Corporate Finance (4th Edition) (Berk, DeMarzo & Harford, The Corporate Finance Series)
Ch. 2 - Prob. 1CCCh. 2 - Prob. 2CCCh. 2 - What 's depreciation designed to capture?Ch. 2 - Prob. 4CCCh. 2 -
5. what do a firm’s earning measure?
Ch. 2 - 6. What is dilution?
Ch. 2 - Prob. 7CCCh. 2 - Prob. 8CCCh. 2 - Prob. 9CCCh. 2 - What information do the notes to financial...
Ch. 2 - Prob. 11CCCh. 2 - Prob. 12CCCh. 2 - Prob. 13CCCh. 2 - Prob. 14CCCh. 2 - Prob. 15CCCh. 2 - Prob. 16CCCh. 2 - Prob. 1CTCh. 2 - Prob. 2CTCh. 2 - Prob. 3CTCh. 2 - 4. What is the purpose of the income statement?
Ch. 2 - Prob. 5CTCh. 2 - Prob. 6CTCh. 2 - Prob. 7CTCh. 2 - Prob. 8CTCh. 2 - Prob. 9CTCh. 2 - Prob. 10CTCh. 2 - Prob. 11CTCh. 2 - This is your second interview with a prestigious...Ch. 2 - Prob. 2DCCh. 2 - Prob. 3DCCh. 2 - Prob. 4DCCh. 2 - Prob. 5DCCh. 2 - Prob. 6DCCh. 2 - Prob. 7DCCh. 2 - Prob. 1PCh. 2 - Prob. 2PCh. 2 - Prob. 3PCh. 2 - Consider the following potential events that might...Ch. 2 - Prob. 5PCh. 2 - Use EDGAR (www.sec.gov) to find Qualcomm's 10K...Ch. 2 - Prob. 7PCh. 2 - Prob. 8PCh. 2 - Prob. 9PCh. 2 - Prob. 10PCh. 2 - Prob. 11PCh. 2 - Prob. 12PCh. 2 - Prob. 13PCh. 2 - Prob. 14PCh. 2 - Prob. 15PCh. 2 - Prob. 16PCh. 2 - Prob. 17PCh. 2 - Prob. 18PCh. 2 - Prob. 19PCh. 2 - In December 2015, Apple had cash of $38.07...Ch. 2 - Prob. 21PCh. 2 - Prob. 22PCh. 2 - Local co. has sales of $10 million and cost of $6...Ch. 2 - 24. If Local Co., the company in Problem 23, had...Ch. 2 - Prob. 25PCh. 2 - Prob. 26PCh. 2 - Prob. 27PCh. 2 - Prob. 28PCh. 2 - Prob. 29PCh. 2 - Prob. 30PCh. 2 - Prob. 31PCh. 2 - Prob. 32PCh. 2 - Prob. 33PCh. 2 - Prob. 34PCh. 2 - Prob. 35PCh. 2 - Prob. 36PCh. 2 - Some balance sheet information is shown here (all...Ch. 2 - Prob. 38P
Knowledge Booster


Learn more about
Need a deep-dive on the concept behind this application? Look no further. Learn more about this topic, finance and related others by exploring similar questions and additional content below.Similar questions
- You have an investment worth $61,345 that is expected to make regular monthly payments of $1,590 for 20 months and a special payment of $X in 3 months. The expected return for the investment is 0.92 percent per month and the first regular payment will be made in 1 month. What is X? Note: X is a positive number.arrow_forwardA bond with a par value of $1,000 and a maturity of 8 years is selling for $925. If the annual coupon rate is 7%, what’s the yield on the bond? What would be the yield if the bond had semiannual payments?arrow_forwardYou want to buy equipment that is available from 2 companies. The price of the equipment is the same for both companies. Silver Fashion would let you make quarterly payments of $14,930 for 8 years at an interest rate of 1.88 percent per quarter. Your first payment to Silver Fashion would be today. Valley Fashion would let you make X monthly payments of $73,323 at an interest rate of 0.70 percent per month. Your first payment to Valley Fashion would be in 1 month. What is X?arrow_forward
- You just bought a new car for $X. To pay for it, you took out a loan that requires regular monthly payments of $1,940 for 12 months and a special payment of $25,500 in 4 months. The interest rate on the loan is 1.06 percent per month and the first regular payment will be made in 1 month. What is X?arrow_forwardYou own 2 investments, A and B, which have a combined total value of $38,199. Investment A is expected to pay $85,300 in 6 years and has an expected return of 18.91 percent per year. Investment B is expected to pay $37,200 in X years and has an expected return of 18.10 percent. What is X?arrow_forwardYou own 2 investments, A and B, which have a combined total value of $51,280. Investment A is expected to pay $57,300 in 5 years and has an expected return of 13.13 percent per year. Investment B is expected to pay $X in 11 years and has an expected return of 12.73 percent per year. What is X?arrow_forward
- Equipment is worth $225,243. It is expected to produce regular cash flows of $51,300 per year for 9 years and a special cash flow of $27,200 in 9 years. The cost of capital is X percent per year and the first regular cash flow will be produced in 1 year. What is X?arrow_forward2 years ago, you invested $13,500. In 2 years, you expect to have $20,472. If you expect to earn the same annual return after 2 years from today as the annual return implied from the past and expected values given in the problem, then in how many years from today do you expect to have $55,607?arrow_forwardYou plan to retire in 5 years with $650,489. You plan to withdraw $88,400 per year for 20 years. The expected return is X percent per year and the first regular withdrawal is expected in 6 years. What is X?arrow_forward
arrow_back_ios
SEE MORE QUESTIONS
arrow_forward_ios
Recommended textbooks for you
 Financial Accounting: The Impact on Decision Make...AccountingISBN:9781305654174Author:Gary A. Porter, Curtis L. NortonPublisher:Cengage Learning
Financial Accounting: The Impact on Decision Make...
Accounting
ISBN:9781305654174
Author:Gary A. Porter, Curtis L. Norton
Publisher:Cengage Learning
Financial ratio analysis; Author: The Finance Storyteller;https://www.youtube.com/watch?v=MTq7HuvoGck;License: Standard Youtube License