
Concept explainers
Videos
The eTech Company is a fairly recent entry in the electronic device area. The company competes with Apple. Samsung, and other well-known companies in the manufacturing and sales of personal handheld devices. Although eTech recognizes that it is a niche player and will likely remain so in the foreseeable future, it is trying to increase its current small market share in this huge competitive market. Jim Simons, VP of Production, and Catherine Dolans, VP of Marketing, have been discussing the possible addition of a new product to the company’s current (rather limited) product line. The tentative name for this new product is ePlayerX. Jim and Catherine agree that the ePlayerX, which will feature a sleeker design and more memory, is necessary to compete successfully with the “big boys,” but they are also worried that the ePlayerX could cannibalize sales of their existing products—and that it could even detract from their bottom line. They must eventually decide how much to spend to develop and manufacture the ePlayerX and how aggressively to market it. Depending on these decisions, they must
The expected timeline for the ePlayerX is that development will take no more than a year to complete and that the product will be introduced in the market a year from now. Jim and Catherine are aware that there are lots of decisions to make and lots of uncertainties involved, but they need to start somewhere. To this end. Jim and Catherine have decided to base their decisions on a planning horizon of four years, including the development year. They realize that the personal handheld device market is very fluid, with updates to existing products occurring almost continuously. However, they believe they can include such considerations into their cost, revenue, and demand estimates, and that a four-year planning horizon makes sense. In addition, they have identified the following problem parameters. (In this first pass, all distinctions are “binary”: low-end or high-end, small-effect or large-effect, and so on.)
- In the absence of cannibalization, the sales of existing eTech products are expected to produce year I net revenues of $10 million, and the forecast of the annual increase in net revenues is 2%.
- The ePIayerX will be developed as either a low-end or a high-end product, with corresponding fixed development costs ($1.5 million or $2.5 million), variable
manufacturing costs ($ 100 or $200). and selling prices ($150 or $300). The fixed development cost is incurred now, at the beginning of year I, and the variable cost and selling price are assumed to remain constant throughout the planning horizon. - The new product will be marketed either mildly aggressively or very aggressively, with corresponding costs. The costs of a mildly aggressive marketing campaign are $1.5 million in year 1 and $0.5 million annually in years 2 to 4. For a very aggressive campaign, these costs increase to $3.5 million and $1.5 million, respectively. (These marketing costs are not part of the variable cost mentioned in the previous bullet; they are separate.)
- Depending on whether the ePlayerX is a low-end or high-end produce the level of the ePlayerX’s cannibalization rate of existing eTech products will be either low (10%) or high (20%). Each cannibalization rate affects only sales of existing products in years 2 to 4, not year I sales. For example, if the cannibalization rate is 10%, then sales of existing products in each of years 2 to 4 will be 10% below their projected values without cannibalization.
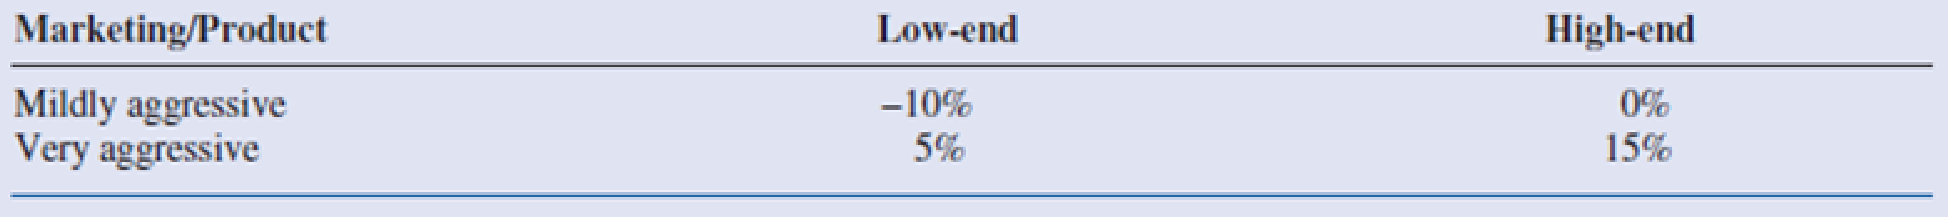
- A “base case” forecast of demand for the ePlayerX is that in its first year on the market, year 2, demand will be for 100,000 units, and then demand will increase by 5% annually in years 3 and 4. This base forecast is based on a low-end version of the ePlayerX and mildly aggressive marketing. It will be adjusted for a high-end will product, aggressive marketing, and competitor behavior. The adjustments with no competing product appear in Table 2.3. The adjustments with a competing product appear in Table 2.4. Each adjustment is to demand for the ePlayerX in each of years 2 to 4. For example, if the adjustment is −10%, then demand in each of years 2 to 4 will be 10% lower than it would have been in the base case.
- Demand and units sold are the same—that is, eTech will produce exactly what its customers demand so that no inventory or backorders will occur.
Table 2.3 Demand Adjustments When No Competing Product Is Introduced

Table 2.4 Demand Adjustments When a Competing Product Is Introduced
Because Jim and Catherine are approaching the day when they will be sharing their plans with other company executives, they have asked you to prepare an Excel spreadsheet model that will answer the many what-if questions they expect to be asked. Specifically, they have asked you to do the following:
- You should enter all of the given data in an “inputs” section with clear labeling and appropriate number formatting. If you believe that any explanations are required, you can enter them in text boxes or cell comments. In this section and in the rest of the model, all monetary values (other than the variable cost and the selling price) should be expressed in millions of dollars, and all demands for the ePlayerX should be expressed in thousands of units.
- You should have a “scenario” section that contains a 0/1 variable for each of the binary options discussed here. For example, one of these should be 0 if the low-end product is chosen and it should be 1 if the high-end product is chosen.
- You should have a “parameters” section that contains the values of the various parameters listed in the case, depending on the values of the 0/1 variables in the previous bullet For example, the fixed development cost will be $1.5 million or $2.5 million depending on whether the 0/1 variable in the previous bullet is 0 or 1, and this can be calculated with a simple IF formula. You can decide how to implement the IF logic for the various parameters.
- You should have a “cash flows” section that calculates the annual cash flows for the four-year period. These cash flows include the net revenues from existing products, the marketing costs for ePlayerX, and the net revenues for sales of ePlayerX (To calculate these latter values, it will help to have a row for annual units sold of ePlayerX.) The cash flows should also include depreciation on the fixed development cost, calculated on a straight-line four-year basis (that is. 25% of the cost in each of the four years). Then, these annual revenues/costs should be summed for each year to get net cash flow before taxes, taxes should be calculated using a 32% tax rate, and taxes should be subtracted and depreciation should be added back in to get net cash flows after taxes. (The point is that depreciation is first subtracted, because it is not taxed, but then it is added back in after taxes have been calculated.)
- You should calculate the company's
NPV for the four-year horizon using a discount rate of 10%. You can assume that the fixed development cost is incurred now. so that it is not discounted, and that all other costs and revenues are incurred at the ends of the respective years. - You should accompany all of this with a line chart with three series: annual net revenues from existing products; annual marketing costs for ePlayerX; and annual net revenues from sales of ePlayerX.
Once all of this is completed. Jim and Catherine will have a powerful tool for presentation purposes. By adjusting the 0/1 scenario variables, their audience will be able to see immediately, both numerically and graphically, the financial consequences of various scenarios. ■
Want to see the full answer?
Check out a sample textbook solution
Chapter 2 Solutions
Practical Management Science


- Prepare a master schedule given this information: The forecast for each week of an eight-week schedule is 60 units. The MPS rule is to schedule production if the projected on-hand Inventory would be negative without it. Customer orders (committed) are as follows: Week Customer Orders 1 2 36 28 4 1 Use a production lot size of 85 units and no beginning inventory. Note: In the ATP row, enter a value of 0 (zero) in any periods where ATP should not be calculated. Leave no cells blank - be certain to enter "0" wherever required. June July 1 2 3 4 5 8 7 8 Forecast 60 60 60 60 60 60 60 60 Customer Orders 38 28 4 1 0 0 0 0 Projected On-Hand Inventory MPS ATParrow_forwardSales of tablet computers at Marika Gonzalez's electronics store in Washington, D.C., over the past 10 weeks are shown in the table below: Week 1 2 3 4 5 6 7 8 9 10 Demand 21 21 27 38 25 30 35 24 25 30 a) The forecast for weeks 2 through 10 using exponential smoothing with a = 0.50 and a week 1 initial forecast of 21.0 are (round your responses to two decimal places): Week 1 2 3 4 5 6 7 8 9 10 Demand 21 21 27 38 25 30 35 24 25 30 Forecast 21.0 21 21 24 31 28 29 32 28 26.50 b) For the forecast developed using exponential smoothing (a = 0.50 and initial forecast 21.0), the MAD = |||||sales (round your response to two decimal places).arrow_forwardSales of tablet computers at Marika Gonzalez's electronics store in Washington, D.C., over the past 10 weeks are shown in the table below: Week Demand 1 2 3 4 5 6 7 8 9 10 21 21 27 38 25 30 35 24 25 30 a) The forecast for weeks 2 through 10 using exponential smoothing with a = 0.50 and a week 1 initial forecast of 21.0 are (round your responses to two decimal places): Week 1 2 3 4 5 Demand 21 21 27 38 Forecast 21.0 ☐ G ☐ ☐ 6 7 25 30 35 ∞ ☐ 8 9 10 24 25 30arrow_forward
- Each machine costs $3 Million. Building the room with all its attendant safety protection and other ancillary costs increases the spending by an additional $2.0 million dollars per MRI suite. Each machine can perform 2000 scans per year. Each reading of an MRI scan by a radiologist, along with other per-scan-related costs, is $500 per scan. The machine will last five years. Don’t worry about discount rates for this problem Graph the total costs over 5 years as a function of sales for 0-3000 patients annually. Hint: you may need to add a second MRI at some point. Suppose that you want to make a profit of $500 per scan at a target volume of 1000 patients per year, and you purchase only one machine. Superimpose the total revenue curve on top of the total cost curve in (1).arrow_forwardI need the answer to requirement C.arrow_forwardImagine you are Susan Kim and are faced with a difficult choice to either follow the orders she was given, or refusing to do so. Using each lens determine what the ethical response would be. Suppot your answer with materials from readings and lectures. For example, using Universalism what would the ethical response be? Do the same for all four lenses.arrow_forward
- Answer all these questions, selecting any company of your choice. Choose a specific type of food company. Select a specific product. Develop all the inputs that are part of the process. Develop the transformation process in a graphic (diagram, etc.). Develop all the outputs or finished products that are part of the process. Describe all the processes involved in one line of production in any manufacturing facility. Also describing how good management is the center of any part of a production company.arrow_forwardUsing exponential smoothing with α =0.2, forecast the demand for The initial forecast for January is 2000 tons. Calculate the capacity utilization for June, July and Discuss the implications of underutilized or over utilized capacity for Green Harvestarrow_forwardIn organizational development when results are improving but relationships are declining, what leadership style is appropriate? directing delegating supporting coachingarrow_forward
- What is the first thing a leader should do when moving through a cultural change? conduct an assessment comparing the practices to other high-performing organizations learn about the current organizational culture continue to monitor key metrics define expectationsarrow_forwardThe third change leadership strategy, Collaborate on Implementation, is designed to address what type of concerns? impact concerns personal concerns refinement concerns collaboration concernsarrow_forwardIf team members are concerned with specifics such as their tasks, contingency plans, resources, and timeline, what concerns do they have? implementation concerns impact concerns refinement concerns personal concernsarrow_forward
 MarketingMarketingISBN:9780357033791Author:Pride, William MPublisher:South Western Educational Publishing
 Practical Management ScienceOperations ManagementISBN:9781337406659Author:WINSTON, Wayne L.Publisher:Cengage,