Business Statistics: A First Course (8th Edition)
8th Edition
ISBN: 9780135177785
Author: David M. Levine, Kathryn A. Szabat, David F. Stephan
Publisher: PEARSON
expand_more
expand_more
format_list_bulleted
Concept explainers
Videos
Textbook Question
Chapter 2, Problem 2.92CRP
Suppose that the owner of the restaurant in Problem 2.91 also wants to study the demand for dessert during the same time period. She decides that in addition to studying whether a dessert was ordered, she will also study the gender of the individual and whether a beef entrée was ordered. Data were collected from 630 customers and organized in the following
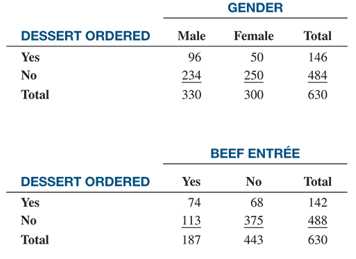
- For each of the two contingency tables, construct contingency tables of row percentages, column percentages. and total percentages.
- Which type of (row, column, or total) do you think is most informative for each gender? For beef entrée? Explain.
- What conclusions concerning the pattern of dessert ordering can the restaurant owner reach?
Expert Solution & Answer
Want to see the full answer?
Check out a sample textbook solution
Students have asked these similar questions
Section 2.2 Subsets
71
Exercise Set 2.2
Practice Exercises
In Exercises 1-18, write or in each blank so that the resulting
statement is true.
1. {1, 2, 5}
{1, 2, 3, 4, 5, 6, 7}
2. {2, 3, 7}
{1, 2, 3, 4, 5, 6, 7}
3. {-3, 0, 3}
{-4,-3,-1, 1, 3, 4}
4. {-4, 0, 4}
5. {Monday, Friday}
{-3, -1, 1, 3}
{Saturday, Sunday, Monday, Tuesday, Wednesday}
6. {Mercury, Venus, Earth}
{Venus, Earth, Mars, Jupiter}
7. {x/x is a cat}
{xx is a black cat}
{x|x is a pure-bred dog}
ibrary
mbers,
ause the
entire
sual
8. {xx is a dog}
9. (c, o, n, v, e, r, s, a, t, i, o, n}
{v, o, i, c, e, s, r, a, n, t, o, n}
10. [r, e, v, o, l, u, t, i, o, n}
{t, o, l, o, v, e, r, u, i, n}
33. A = {x|x E N
and
5 < x < 12}
B
=
{x|x E N
and
2 ≤ x ≤ 11}
A_ B
34. A =
{x|x = N
and
3 < x < 10}
B =
A.
{x|x = N
and
2 ≤ x ≤ 8}
B
35. Ø
{7, 8, 9,..., 100}
36. Ø
_{101, 102, 103, . . ., 200}
37. [7, 8, 9,...}
38. [101, 102, 103, ...}
39. Ø
40. { }
{ }
e
In Exercises 41-54, determine whether each statement is true or
false. If…
A = 5.8271 ± 0.1497
=
B 1.77872 ± 0.01133
C=0.57729 ± 0.00908
1. Find the relative uncertainty of A, B, and C
2. Find A-3
3. Find 7B
4. Find A + B
5. Find A B-B
-
6. Find A * B
7. Find C/B
8. Find 3/A
9. Find A 0.3B
-
10. Find C/T
11. Find 1/√A
12. Find AB²
Why charts,graphs,table??? difference between regression and correlation analysis.
Chapter 2 Solutions
Business Statistics: A First Course (8th Edition)
Ch. 2 - Prob. 2.1LBCh. 2 - The following data represent the responses to two...Ch. 2 - Prob. 2.3ACCh. 2 - Prob. 2.5ACCh. 2 - Prob. 2.6ACCh. 2 - Prob. 2.7ACCh. 2 - Prob. 2.8ACCh. 2 - Prob. 2.10ACCh. 2 - Prob. 2.11LBCh. 2 - Prob. 2.12LB
Ch. 2 - Prob. 2.14LBCh. 2 - The file UTILITY contains the following data about...Ch. 2 - One operation of a mill to cut pieces of steel...Ch. 2 - Prob. 2.21ACCh. 2 - Prob. 2.23ACCh. 2 - Prob. 2.25ACCh. 2 - Prob. 2.26ACCh. 2 - The following table indicates the percentage of...Ch. 2 - Prob. 2.29ACCh. 2 - Prob. 2.30ACCh. 2 - Prob. 2.31ACCh. 2 - Prob. 2.32ACCh. 2 - Prob. 2.33LBCh. 2 - Prob. 2.34LBCh. 2 - Prob. 2.35ACCh. 2 - The file UTILITY contains the following data about...Ch. 2 - Prob. 2.39ACCh. 2 - Prob. 2.43ACCh. 2 - The data stored in DRINK represents the amount of...Ch. 2 - Prob. 2.48LBCh. 2 - Prob. 2.49LBCh. 2 - Prob. 2.50ACCh. 2 - Data were collected on the typical cost of dining...Ch. 2 - Prob. 2.53ACCh. 2 - Prob. 2.54ACCh. 2 - Prob. 2.55ACCh. 2 - Prob. 2.56ACCh. 2 - Using the sample of retirement funds stored in...Ch. 2 - Prob. 2.59ACCh. 2 - Using the sample of retirement funds stored in...Ch. 2 - Using the sample of retirement funds stored in...Ch. 2 - Prob. 2.62ACCh. 2 - Prob. 2.70ACCh. 2 - Prob. 2.71ACCh. 2 - Prob. 2.72ACCh. 2 - Prob. 2.73ACCh. 2 - Prob. 2.75ACCh. 2 - Prob. 2.76ACCh. 2 - Prob. 2.77CYUCh. 2 - Prob. 2.78CYUCh. 2 - What are the advantages and disadvantages of using...Ch. 2 - Compare and contrast the bar chart for categorical...Ch. 2 - Prob. 2.81CYUCh. 2 - Prob. 2.82CYUCh. 2 - What are the three different ways to break down...Ch. 2 - How can a multidimensional table differ from a...Ch. 2 - Prob. 2.85CYUCh. 2 - Prob. 2.89CRPCh. 2 - The owner of a restaurant that serves...Ch. 2 - Suppose that the owner of the restaurant in...Ch. 2 - Prob. 2.94CRPCh. 2 - One of the major measures of the quality of...Ch. 2 - Prob. 2.103CRPCh. 2 - Prob. 2.104CRPCh. 2 - Prob. 2.105CRPCh. 2 - Prob. 2.109RWE
Additional Math Textbook Solutions
Find more solutions based on key concepts
For Exercises 13–18, write the negation of the statement.
13. The cell phone is out of juice.
Math in Our World
1. How much money is Joe earning when he’s 30?
Pathways To Math Literacy (looseleaf)
Let F be a continuous distribution function. If U is uniformly distributed on (0,1), find the distribution func...
A First Course in Probability (10th Edition)
23. A plant nursery sells two sizes of oak trees to landscapers. Large trees cost the nursery $120 from the gro...
College Algebra (Collegiate Math)
Reading, Writing, and Rounding Whole Numbers Write in words. 357
Mathematics for the Trades: A Guided Approach (11th Edition) (What's New in Trade Math)
Provide an example of a qualitative variable and an example of a quantitative variable.
Elementary Statistics ( 3rd International Edition ) Isbn:9781260092561
Knowledge Booster


Learn more about
Need a deep-dive on the concept behind this application? Look no further. Learn more about this topic, statistics and related others by exploring similar questions and additional content below.Similar questions
- You’re scrolling through Instagram and you notice that a lot of people are posting selfies. This piques yourcuriosity and you want to estimate the percentage of photos on Instagram that are selfies.(a) (5 points) Is there a “ground truth” for the percentage of selfies on Instagram? Why or why not?(b) (5 points) Is it possible to estimate the ground truth percentage of selfies on Instagram?Irrespective of your answer to the previous question, you decide to pull up n = 250 randomly chosenphotos from your friends’ Instagram accounts and find that 32% of these photos are selfies.(c) (15 points) Determine which of the following is an observation, a variable, a sample statistic (valuecalculated based on the observed sample), or a population parameter.• A photo on Instagram.• Whether or not a photo is a selfie.• Percentage of all photos on Instagram that are selfies.• 32%.(d) (5 points) Based on the sample you collected, do you think 32% is a reliable ballpark estimate for theground truth…arrow_forwardCan you explain this statement below in layman's terms? Secondary Analysis with Generalized Linear Mixed Model with clustering for Hospital Center and ICUvs Ward EnrolmentIn a secondary adjusted analysis we used generalized linear mixed models with random effects forcenter (a stratification variable in the primary analyses). In this analysis, the relative risk for the primaryoutcome of 90-day mortality for 7 versus 14 days of antibiotics was 0.90 (95% Confidence Interval [CI]0.78, 1.05).arrow_forwardIn a crossover trial comparing a new drug to a standard, π denotes the probabilitythat the new one is judged better. It is desired to estimate π and test H0 : π = 0.5against H1 : π = 0.5. In 20 independent observations, the new drug is better eachtime.(a) Find and plot the likelihood function. Give the ML estimate of π (Hint: youmay use the plot function in R)arrow_forward
- Can you explain what this analysis means in layman's terms? - We calculated that a target sample size of 3626, which was based on anticipated baseline 90-day mortality of 22% and a noninferiority margin of no more than 4 percentage points, would give the trial 80% power, at a one-sided alpha level of 2.5%, accounting for a maximum of 5% loss to follow-up and for early stopping rules for three interim analyses.-arrow_forwardCan you help me understand this analysis? A 95.7% confidence interval is shown for the intention-to-treat analysis (accounting for alpha spending in interim analyses), and 95% confidence intervals are shown for the other two analyses. The widths of the confidence intervals have not been adjusted for multiplicity. The dashed line indicates the noninferiority margin of 4 percentage points.arrow_forwardTitle: Analyzing Customer Satisfaction for UnileverAs a member of Unilever's Customer Experience Management team, you are responsible forevaluating customer satisfaction levels and monitoring competitive moves. This case studyinvolves analyzing satisfaction data to test two key hypotheses about Unilever's performancerelative to its main competitor, Procter & Gamble (P&G).Unilever’s leadership team has emphasized the importance of customer satisfaction inmaintaining competitive advantage and market leadership. As part of this initiative, yourteam regularly monitors satisfaction scores and benchmarks them against competitors likeP&G.You are tasked with analyzing the provided dataset to answer the following questions:1. Does Unilever’s average customer satisfaction score meet the minimum threshold of2. 75%?Is there no significant difference between Unilever’s overall average satisfaction scoreand P&G’s average satisfaction score?arrow_forward
- Need help answering wuestionarrow_forwardThe following table shows a data set containing information for 25 of the shadow stocks tracked by the American Association of Individual Investors (aaii.com, February 2002). Shadow stocks are common stocks of smaller companies that are not closely followed by Wall Street analysts. Click on the datafile logo to reference the data. DATA file Company DeWolfe Companies Exchange Ticker Symbol Market Cap ($ millions) Price/ Gross Profit Earnings Ratio Margin (%) AMEX DWL 36.4 8.4 36.7 North Coast Energy OTC NCEB 52.5 6.2 59.3 Hansen Natural Corp. OTC HANS 41.1 14.6 44.8 MarineMax, Inc. NYSE HZO 111.5 7.2 23.8 Nanometrics Incorporated OTC NANO 228.6 38.0 53.3 TeamStaff, Inc. OTC TSTF 92.1 33.5 4.1 Environmental Tectonics AMEX ETC 51.1 35.8 35.9 Measurement Specialties AMEX MSS 101.8 26.8 37.6 SEMCO Energy, Inc. NYSE SEN 193.4 18.7 23.6 Party City Corporation OTC PCTY 97.2 15.9 36.4 Embrex, Inc. OTC EMBX 136.5 18.9 59.5 Tech/Ops Sevcon, Inc. AMEX ΤΟ 23.2 20.7 35.7 ARCADIS NV OTC ARCAF 173.4…arrow_forwardThe following table shows a data set containing information for 25 of the shadow stocks tracked by the American Association of Individual Investors (aaii.com, February 2002). Shadow stocks are common stocks of smaller companies that are not closely followed by Wall Street analysts. Click on the datafile logo to reference the data. DATA file Company DeWolfe Companies Exchange AMEX Ticker Symbol Market Cap Price/ Gross Profit Earnings Margin ($ millions) Ratio (%) DWL 36.4 8.4 36.7 North Coast Energy OTC NCEB 52.5 6.2 59.3 Hansen Natural Corp. OTC HANS 41.1 14.6 44.8 MarineMax, Inc. NYSE HZO 111.5 7.2 23.8 Nanometrics Incorporated OTC NANO 228.6 38.0 53.3 TeamStaff, Inc. OTC TSTF 92.1 33.5 4.1 Environmental Tectonics AMEX ETC 51.1 35.8 35.9 Measurement Specialties AMEX MSS 101.8 26.8 37.6 SEMCO Energy, Inc. NYSE SEN 193.4 18.7 23.6 Party City Corporation OTC PCTY 97.2 15.9 36.4 Embrex, Inc. OTC EMBX 136.5 18.9 59.5 Tech/Ops Sevcon, Inc. AMEX ΤΟ 23.2 20.7 35.7 ARCADIS NV OTC ARCAF 173.4…arrow_forward
- The following data show the year to date percent change (YTD % Change) for 30 stock-market indexes from around the word (The Wall Street Journal, August 26, 2013). a. What index has the largest positive YTD % Change? Round your answer to once decimal place. index with a YTD % Change of % b. Using a class width of 5 beginning with -20 and going to 40, develop a frequency distribution for the data. YTD % Change Frequency -20 - -15 -15 - -10 -10 - -5 -5 - 0 0 - 5 5 - 10 10 - 15 15 - 20 20 - 25 30 - 35 c. 1. 2. 3. 4.arrow_forwardThe following data show the year to date percent change (YTD % Change) for 30 stock-market indexes from around the word (The Wall Street Journal, August 26, 2013). Click on the datafile logo to reference the data. DATA file Country Australia Index S&P/ASX200 YTD % Change 10.2 Belgium Bel-20 12.6 Brazil São Paulo Bovespa -14.4 Canada S&P/TSX Comp 2.6 Chile Santiago IPSA -16.3 China Shanghai Composite -9.3 Eurozone EURO Stoxx 10.0 France CAC 40 11.8 Germany DAX 10.6 Hong Kong Hang Seng -3.5 India S&P BSE Sensex -4.7 Israel Tel Aviv 1.3 Italy FTSE MIB 6.6 Japan Nikkei 31.4 Mexico IPC All-Share -6.4 Netherlands AEX 9.3 Singapore Straits Times -2.5 South Korea Kospi -6.4 Spain IBEX 35 6.4 Sweden Switzerland SX All Share 13.8 Swiss Market 17.4 Taiwan Weighted 2.3 U.K. FTSE 100 10.1 U.S. S&P 500 16.6 U.S. DJIA 14.5 U.S. Dow Jones Utility 6.6 U.S. Nasdaq 100 17.4 U.S. Nasdaq Composite 21.1 World DJ Global ex U.S. 4.2 World DJ Global Index 9.9 a. What index has the largest positive YTD %…arrow_forwardDescribe a three step process you choose to determine how many elementary schools there are in the city of 5 million people.arrow_forward
arrow_back_ios
SEE MORE QUESTIONS
arrow_forward_ios
Recommended textbooks for you
 Glencoe Algebra 1, Student Edition, 9780079039897...AlgebraISBN:9780079039897Author:CarterPublisher:McGraw Hill
 Linear Algebra: A Modern IntroductionAlgebraISBN:9781285463247Author:David PoolePublisher:Cengage Learning
 Holt Mcdougal Larson Pre-algebra: Student Edition...AlgebraISBN:9780547587776Author:HOLT MCDOUGALPublisher:HOLT MCDOUGAL
Glencoe Algebra 1, Student Edition, 9780079039897...
Algebra
ISBN:9780079039897
Author:Carter
Publisher:McGraw Hill
Linear Algebra: A Modern Introduction
Algebra
ISBN:9781285463247
Author:David Poole
Publisher:Cengage Learning
Holt Mcdougal Larson Pre-algebra: Student Edition...
Algebra
ISBN:9780547587776
Author:HOLT MCDOUGAL
Publisher:HOLT MCDOUGAL
The Shape of Data: Distributions: Crash Course Statistics #7; Author: CrashCourse;https://www.youtube.com/watch?v=bPFNxD3Yg6U;License: Standard YouTube License, CC-BY
Shape, Center, and Spread - Module 20.2 (Part 1); Author: Mrmathblog;https://www.youtube.com/watch?v=COaid7O_Gag;License: Standard YouTube License, CC-BY
Shape, Center and Spread; Author: Emily Murdock;https://www.youtube.com/watch?v=_YyW0DSCzpM;License: Standard Youtube License