
Whether figures are important effect for companies
Agreement The purpose of a life-cycle cost is one that goes through the entire process from start to finish. The graph below shows different stages in product life cycle.
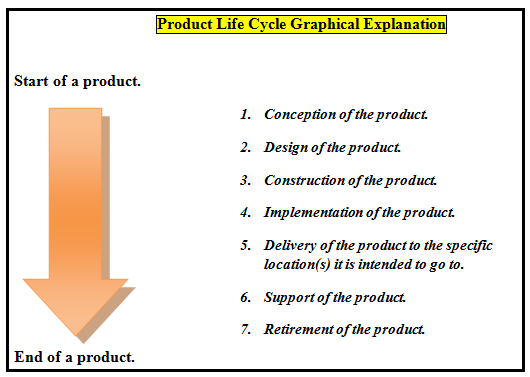
As one can see, there are a number of stages that a product has to go through in order for a cost to qualify as a product life cycle cost. The concepts of age and life cycle apply to products in much the same way as a product life cycle cost. The concepts of age and life cycle apply to products in much the same way as they apply to humans. A product begins as an infant with an idea, grows up and builds momentum over time, matures, and then deteriorates before sadly passing away.
Refer to the figure. The first graphic is the cumulative life cycle of dollars spent on a good, product or a service. On a closer look, it resembles to a partridge. As the product goes through the processes, the amount of money committed is much higher than the costs that are spent for the product. However, as it nears the retirement or declining time of the product, both the costs committed as well as spent are nearly equal before they are fully exhausted.
There are several takeaways that one get from the graph. First, then costs that are committed to the product are much higher than those in the latter phases. The second takeaway is that the companies that are developing the goods, products, or services want to maximize the value per dollar spent on the product as early as possible. Thus, the benefits are also not realized until the product is produced in some quantity. Even then, it usually take s extra time for the benefits to be realized.
The second figure focuses on the ease of making changes to the product, good, or service. Here, as the product passes through different phases, the cost to implement changes increases to the point where it equals to the cost. The production phase is the optimal time to make changes because the adjustment costs are roughly half the cost of the product.
The flip side of the graphic is the ease to change the product. It is much more difficult to change the product in the earlier phases because there are many unknown consequences that could arise due to changes implemented. However, as the time goes on, the ease to make changes increases as well. Once the product is retired, changes can then be made prior to the creation of a new product replacement.
Conclusion:
In short, there are certain takeaways from this comparative analysis of the two different graphics. The first is the intention to show that changes made earlier are less expensive to implement. The second takeaway is that the quality of the product, goods, and services will be better when these are made sooner in the process. Finally, integrated, cross-functional, and enterprise-wide approaches to the product design and execution will be better for companies at present, than rash major changes throughout the design process.
Want to see the full answer?
Check out a sample textbook solution
Chapter 2 Solutions
ENGINEERING ECO ANALYSIS W/STUDY GUIDE

- Your marketing department has identified the following customer demographics in the following table. Construct a demand curve and determine the profit maximizing price as well as the expected profit if MC=$1. The number of customers in the target population is 10,000. Use the following demand data: Group Value Frequency Baby boomers $5 20% Generation X $4 10% Generation Y $3 10% `Tweeners $2 10% Seniors $2 10% Others $0 40%arrow_forwardYour marketing department has identified the following customer demographics in the following table. Construct a demand curve and determine the profit maximizing price as well as the expected profit if MC=$1. The number of customers in the target population is 10,000. Group Value Frequency Baby boomers $5 20% Generation X $4 10% Generation Y $3 10% `Tweeners $2 10% Seniors $2 10% Others $0 40% ur marketing department has identified the following customer demographics in the following table. Construct a demand curve and determine the profit maximizing price as well as the expected profit if MC=$1. The number of customers in the target population is 10,000.arrow_forwardTest Preparation QUESTION 2 [20] 2.1 Body Mass Index (BMI) is a summary measure of relative health. It is calculated by dividing an individual's weight (in kilograms) by the square of their height (in meters). A small sample was drawn from the population of UWC students to determine the effect of exercise on BMI score. Given the following table, find the constant and slope parameters of the sample regression function of BMI = f(Weekly exercise hours). Interpret the two estimated parameter values. X (Weekly exercise hours) Y (Body-Mass index) QUESTION 3 2 4 6 8 10 12 41 38 33 27 23 19 Derek investigates the relationship between the days (per year) absent from work (ABSENT) and the number of years taken for the worker to be promoted (PROMOTION). He interviewed a sample of 22 employees in Cape Town to obtain information on ABSENT (X) and PROMOTION (Y), and derived the following: ΣΧ ΣΥ 341 ΣΧΥ 176 ΣΧ 1187 1012 3.1 By using the OLS method, prove that the constant and slope parameters of the…arrow_forward
- QUESTION 2 2.1 [30] Mariana, a researcher at the World Health Organisation (WHO), collects information on weekly study hours (HOURS) and blood pressure level when writing a test (BLOOD) from a sample of university students across the country, before running the regression BLOOD = f(STUDY). She collects data from 5 students as listed below: X (STUDY) 2 Y (BLOOD) 4 6 8 10 141 138 133 127 123 2.1.1 By using the OLS method and the information above derive the values for parameters B1 and B2. 2.1.2 Derive the RSS (sum of squares for the residuals). 2.1.3 Hence, calculate ô 2.2 2.3 (6) (3) Further, she replicates her study and collects data from 122 students from a rival university. She derives the residuals followed by computing skewness (S) equals -1.25 and kurtosis (K) equals 8.25 for the rival university data. Conduct the Jacque-Bera test of normality at a = 0.05. (5) Upon tasked with deriving estimates of ẞ1, B2, 82 and the standard errors (SE) of ẞ1 and B₂ for the replicated data.…arrow_forwardIf you were put in charge of ensuring that the mining industry in canada becomes more sustainable over the course of the next decade (2025-2035), how would you approach this? Come up with (at least) one resolution for each of the 4 major types of conflict: social, environmental, economic, and politicalarrow_forwardHow is the mining industry related to other Canadian labour industries? Choose one other industry, (I chose Forestry)and describe how it is related to the mining industry. How do the two industries work together? Do they ever conflict, or do they work well together?arrow_forward
- What is the primary, secondary, tertiary, and quaternary levels of mining in Canada For each level, describe what types of careers are the most common, and describe what stage your industry’s main resource is in during that stagearrow_forwardHow does the mining industry in canada contribute to the Canadian economy? Describe why your industry is so important to the Canadian economy What would happen if your industry disappeared, or suffered significant layoffs?arrow_forwardWhat is already being done to make mining in canada more sustainable? What efforts are being made in order to make mining more sustainable?arrow_forward
- What are the environmental challenges the canadian mining industry face? Discuss current challenges that mining faces with regard to the environmentarrow_forwardWhat sustainability efforts have been put forth in the mining industry in canada Are your industry’s resources renewable or non-renewable? How do you know? Describe your industry’s reclamation processarrow_forwardHow does oligopolies practice non-price competition in South Africa?arrow_forward

 Principles of Economics (12th Edition)EconomicsISBN:9780134078779Author:Karl E. Case, Ray C. Fair, Sharon E. OsterPublisher:PEARSON
 Engineering Economy (17th Edition)EconomicsISBN:9780134870069Author:William G. Sullivan, Elin M. Wicks, C. Patrick KoellingPublisher:PEARSON
 Principles of Economics (MindTap Course List)EconomicsISBN:9781305585126Author:N. Gregory MankiwPublisher:Cengage Learning
 Managerial Economics: A Problem Solving ApproachEconomicsISBN:9781337106665Author:Luke M. Froeb, Brian T. McCann, Michael R. Ward, Mike ShorPublisher:Cengage Learning
 Managerial Economics & Business Strategy (Mcgraw-...EconomicsISBN:9781259290619Author:Michael Baye, Jeff PrincePublisher:McGraw-Hill Education