
STAT TECH IN BUSINESS & ECON AC
18th Edition
ISBN: 9781264731657
Author: Lind
Publisher: MCG
expand_more
expand_more
format_list_bulleted
Concept explainers
Videos
Textbook Question
Chapter 2, Problem 25CE
Alexandra Damonte will be building a new resort in Myrtle Beach, South Carolina. She must decide how to design the resort based on the type of activities that the resort will offer to its customers. A recent poll of 300 potential customers showed the following results about customers’ preferences for planned resort activities:
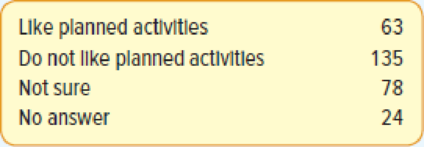
- a. What is the table called?
- b. Draw a bar chart to portray the survey results.
- c. Draw a pie chart for the survey results.
- d. If you are preparing to present the results to Ms. Damonte as part of a report, which graph would you prefer to show? Why?
Expert Solution & Answer
Want to see the full answer?
Check out a sample textbook solution
Students have asked these similar questions
Stem1: 1,4
Stem 2: 2,4,8
Stem3: 2,4
Stem4: 0,1,6,8
Stem5: 0,1,2,3,9
Stem 6: 2,2
What’s the Min,Q1, Med,Q3,Max?
Are the t-statistics here greater than 1.96? What do you conclude?
colgPA= 1.39+0.412 hsGPA
(.33) (0.094)
Find the P value
A poll before the elections showed that in a given sample 79% of people vote for candidate C. How many people should be interviewed so that the pollsters can be 99% sure that from 75% to 83% of the population will vote for candidate C? Round your answer to the whole number.
Chapter 2 Solutions
STAT TECH IN BUSINESS & ECON AC
Ch. 2 - DeCenzo Specialty Food and Beverage Company has...Ch. 2 - A pie chart shows the relative market share of...Ch. 2 - In a marketing study, 100 consumers were asked to...Ch. 2 - A total of 1,000 residents in Minnesota were asked...Ch. 2 - Two thousand frequent business travelers are asked...Ch. 2 - Wellstone Inc. produces and markets replacement...Ch. 2 - A small business consultant is investigating the...Ch. 2 - In the first quarter of last year, the 11 members...Ch. 2 - Prob. 3SRCh. 2 - A set of data consists of 38 observations. How...
Ch. 2 - A set of data consists of 45 observations between...Ch. 2 - A set of data consists of 230 observations between...Ch. 2 - A set of data contains 53 observations. The...Ch. 2 - Wachesaw Manufacturing Inc. produced the following...Ch. 2 - The Quick Change Oil Company has a number of...Ch. 2 - The manager of the BiLo Supermarket in Mt....Ch. 2 - The food services division of Cedar River...Ch. 2 - The annual imports of a selected group of...Ch. 2 - Mollys Candle Shop has several retail stores in...Ch. 2 - The following chart shows the number of patients...Ch. 2 - The following frequency distribution reports the...Ch. 2 - Prob. 18ECh. 2 - A sample of the hourly wages of 15 employees at...Ch. 2 - The following cumulative frequency and the...Ch. 2 - The cumulative frequency and the cumulative...Ch. 2 - The frequency distribution representing the number...Ch. 2 - Prob. 22ECh. 2 - Describe the similarities and differences of...Ch. 2 - Describe the similarities and differences between...Ch. 2 - Alexandra Damonte will be building a new resort in...Ch. 2 - Prob. 26CECh. 2 - A data set consists of 83 observations. How many...Ch. 2 - A data set consists of 145 observations that range...Ch. 2 - The following is the number of minutes to commute...Ch. 2 - The following data give the weekly amounts spent...Ch. 2 - A social scientist is studying the use of iPods by...Ch. 2 - David Wise handles his own investment portfolio,...Ch. 2 - Prob. 33CECh. 2 - The monthly issues of the Journal of Finance are...Ch. 2 - The following histogram shows the scores on the...Ch. 2 - The following chart summarizes the selling price...Ch. 2 - A chain of sport shops catering to beginning...Ch. 2 - Prob. 38CECh. 2 - A recent survey showed that the typical American...Ch. 2 - Midland National Bank selected a sample of 40...Ch. 2 - Residents of the state of South Carolina earned a...Ch. 2 - A recent study of home technologies reported the...Ch. 2 - Merrill Lynch recently completed a study regarding...Ch. 2 - Prob. 44CECh. 2 - Refer to the following chart: a. What is the name...Ch. 2 - The following chart depicts the annual revenues,...Ch. 2 - Prob. 47CECh. 2 - Prob. 48CECh. 2 - One of the most popular candies in the United...Ch. 2 - The number of families who used the Minneapolis...Ch. 2 - Refer to the North Valley Real Estate data that...Ch. 2 - Prob. 52DACh. 2 - Refer to the Lincolnville School District bus...
Knowledge Booster


Learn more about
Need a deep-dive on the concept behind this application? Look no further. Learn more about this topic, statistics and related others by exploring similar questions and additional content below.Similar questions
- Suppose a random sample of 459 married couples found that 307 had two or more personality preferences in common. In another random sample of 471 married couples, it was found that only 31 had no preferences in common. Let p1 be the population proportion of all married couples who have two or more personality preferences in common. Let p2 be the population proportion of all married couples who have no personality preferences in common. Find a95% confidence interval for . Round your answer to three decimal places.arrow_forwardA history teacher interviewed a random sample of 80 students about their preferences in learning activities outside of school and whether they are considering watching a historical movie at the cinema. 69 answered that they would like to go to the cinema. Let p represent the proportion of students who want to watch a historical movie. Determine the maximal margin of error. Use α = 0.05. Round your answer to three decimal places. arrow_forwardA random sample of medical files is used to estimate the proportion p of all people who have blood type B. If you have no preliminary estimate for p, how many medical files should you include in a random sample in order to be 99% sure that the point estimate will be within a distance of 0.07 from p? Round your answer to the next higher whole number.arrow_forward
- A clinical study is designed to assess the average length of hospital stay of patients who underwent surgery. A preliminary study of a random sample of 70 surgery patients’ records showed that the standard deviation of the lengths of stay of all surgery patients is 7.5 days. How large should a sample to estimate the desired mean to within 1 day at 95% confidence? Round your answer to the whole number.arrow_forwardA clinical study is designed to assess the average length of hospital stay of patients who underwent surgery. A preliminary study of a random sample of 70 surgery patients’ records showed that the standard deviation of the lengths of stay of all surgery patients is 7.5 days. How large should a sample to estimate the desired mean to within 1 day at 95% confidence? Round your answer to the whole number.arrow_forwardIn the experiment a sample of subjects is drawn of people who have an elbow surgery. Each of the people included in the sample was interviewed about their health status and measurements were taken before and after surgery. Are the measurements before and after the operation independent or dependent samples?arrow_forward
- iid 1. The CLT provides an approximate sampling distribution for the arithmetic average Ỹ of a random sample Y₁, . . ., Yn f(y). The parameters of the approximate sampling distribution depend on the mean and variance of the underlying random variables (i.e., the population mean and variance). The approximation can be written to emphasize this, using the expec- tation and variance of one of the random variables in the sample instead of the parameters μ, 02: YNEY, · (1 (EY,, varyi n For the following population distributions f, write the approximate distribution of the sample mean. (a) Exponential with rate ẞ: f(y) = ß exp{−ßy} 1 (b) Chi-square with degrees of freedom: f(y) = ( 4 ) 2 y = exp { — ½/ } г( (c) Poisson with rate λ: P(Y = y) = exp(-\} > y! y²arrow_forward2. Let Y₁,……., Y be a random sample with common mean μ and common variance σ². Use the CLT to write an expression approximating the CDF P(Ỹ ≤ x) in terms of µ, σ² and n, and the standard normal CDF Fz(·).arrow_forwardmatharrow_forward
- Compute the median of the following data. 32, 41, 36, 42, 29, 30, 40, 22, 25, 37arrow_forwardTask Description: Read the following case study and answer the questions that follow. Ella is a 9-year-old third-grade student in an inclusive classroom. She has been diagnosed with Emotional and Behavioural Disorder (EBD). She has been struggling academically and socially due to challenges related to self-regulation, impulsivity, and emotional outbursts. Ella's behaviour includes frequent tantrums, defiance toward authority figures, and difficulty forming positive relationships with peers. Despite her challenges, Ella shows an interest in art and creative activities and demonstrates strong verbal skills when calm. Describe 2 strategies that could be implemented that could help Ella regulate her emotions in class (4 marks) Explain 2 strategies that could improve Ella’s social skills (4 marks) Identify 2 accommodations that could be implemented to support Ella academic progress and provide a rationale for your recommendation.(6 marks) Provide a detailed explanation of 2 ways…arrow_forwardQuestion 2: When John started his first job, his first end-of-year salary was $82,500. In the following years, he received salary raises as shown in the following table. Fill the Table: Fill the following table showing his end-of-year salary for each year. I have already provided the end-of-year salaries for the first three years. Calculate the end-of-year salaries for the remaining years using Excel. (If you Excel answer for the top 3 cells is not the same as the one in the following table, your formula / approach is incorrect) (2 points) Geometric Mean of Salary Raises: Calculate the geometric mean of the salary raises using the percentage figures provided in the second column named “% Raise”. (The geometric mean for this calculation should be nearly identical to the arithmetic mean. If your answer deviates significantly from the mean, it's likely incorrect. 2 points) Starting salary % Raise Raise Salary after raise 75000 10% 7500 82500 82500 4% 3300…arrow_forward
arrow_back_ios
SEE MORE QUESTIONS
arrow_forward_ios
Recommended textbooks for you
 Glencoe Algebra 1, Student Edition, 9780079039897...AlgebraISBN:9780079039897Author:CarterPublisher:McGraw Hill
 Big Ideas Math A Bridge To Success Algebra 1: Stu...AlgebraISBN:9781680331141Author:HOUGHTON MIFFLIN HARCOURTPublisher:Houghton Mifflin Harcourt
 Holt Mcdougal Larson Pre-algebra: Student Edition...AlgebraISBN:9780547587776Author:HOLT MCDOUGALPublisher:HOLT MCDOUGAL
Glencoe Algebra 1, Student Edition, 9780079039897...
Algebra
ISBN:9780079039897
Author:Carter
Publisher:McGraw Hill
Big Ideas Math A Bridge To Success Algebra 1: Stu...
Algebra
ISBN:9781680331141
Author:HOUGHTON MIFFLIN HARCOURT
Publisher:Houghton Mifflin Harcourt
Holt Mcdougal Larson Pre-algebra: Student Edition...
Algebra
ISBN:9780547587776
Author:HOLT MCDOUGAL
Publisher:HOLT MCDOUGAL
Sampling Methods and Bias with Surveys: Crash Course Statistics #10; Author: CrashCourse;https://www.youtube.com/watch?v=Rf-fIpB4D50;License: Standard YouTube License, CC-BY
Statistics: Sampling Methods; Author: Mathispower4u;https://www.youtube.com/watch?v=s6ApdTvgvOs;License: Standard YouTube License, CC-BY