
Concept explainers
Videos
The breakdown of U.S. cities having a population of at least 10,000 persons has been reported as follows. Source: Bureau of the Census, Statistical Abstract of the United States 2009, p.34.
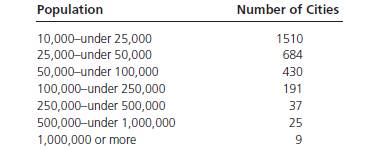
a. How many cities have a population of a least 25,000 but less than 500,000?
b. How many cities have a population less than 2.50,000?
c. How many cities have a population of at least 100,000 but less than 1,000,000? What percentage of cities are in this group?
d. What is the class mark for the 100,000—under 250,000 class?
e. Convert the table to a relative frequency distribution.
(a)
To find:
The number of cities that have a population of at least 25,000 but less than 500,000.
Answer to Problem 2.55CE
1342.
Explanation of Solution
Given:
Frequency distribution is:
| Population | Number of Cities |
| 10,000- under 25,000 | 1510 |
| 25,000 -under 50,000 | 684 |
| 50,000 -under 100,000 | 430 |
| 100,000 - under 250,000 | 191 |
| 250,000 - under 500,000 | 37 |
| 500,000- under 1,000,000 | 25 |
| 1,000,000 or more | 9 |
The number of cities that have a population of at least 25,000 but less than 500,000 can be calculated as:
Hence, the required number is 1342.
(b)
To find:
The number of cities that have population of less than 250,000.
Answer to Problem 2.55CE
2815.
Explanation of Solution
The number of cities that have a population less than 250,000 can be calculated as:
Hence, the required number is 2815.
(c)
To find:
The number of cities that have a population of at least 100,000 but less than 1,000,000. Also, find the percentages of cities in this group.
Answer to Problem 2.55CE
253 cities and 8.77%.
Explanation of Solution
The number of cities that have a population of at least 100,000 but less than 1,000,000 can be calculated as:
The percentage of cities in this group be calculated as:
(d)
To find:
The class mark for the class 100,000-under 250,000.
Answer to Problem 2.55CE
175000.
Explanation of Solution
The class-mark or mid-point of an interval is calculated as:
The class mark for the class 100,000-under 250,000can be calculated as:
(d)
To find:
A relative frequency distribution for the provided data set.
Explanation of Solution
| Population | Relative frequency |
| 10,000- under 25,000 | 0.523 |
| 25,000 -under 50,000 | 0.237 |
| 50,000 -under 100,000 | 0.149 |
| 100,000 - under 250,000 | 0.066 |
| 250,000 - under 500,000 | 0.013 |
| 500,000- under 1,000,000 | 0.009 |
| 1,000,000 or more | 0.003 |
Want to see more full solutions like this?
Chapter 2 Solutions
Introduction to Business Statistics
Additional Math Textbook Solutions
College Algebra (7th Edition)
Finite Mathematics for Business, Economics, Life Sciences and Social Sciences
Elementary Statistics: Picturing the World (7th Edition)
Basic College Mathematics
Introductory Statistics
Pathways To Math Literacy (looseleaf)


- 30 Explain how you can use the empirical rule to find out whether a data set is mound- shaped, using only the values of the data themselves (no histogram available).arrow_forward5. Let X be a positive random variable with finite variance, and let A = (0, 1). Prove that P(X AEX) 2 (1-A)² (EX)² EX2arrow_forward6. Let, for p = (0, 1), and xe R. X be a random variable defined as follows: P(X=-x) = P(X = x)=p. P(X=0)= 1-2p. Show that there is equality in Chebyshev's inequality for X. This means that Chebyshev's inequality, in spite of being rather crude, cannot be improved without additional assumptions.arrow_forward
- 4. Prove that, for any random variable X, the minimum of EIX-al is attained for a = med (X).arrow_forward8. Recall, from Sect. 2.16.4, the likelihood ratio statistic, Ln, which was defined as a product of independent, identically distributed random variables with mean 1 (under the so-called null hypothesis), and the, sometimes more convenient, log-likelihood, log L, which was a sum of independent, identically distributed random variables, which, however, do not have mean log 1 = 0. (a) Verify that the last claim is correct, by proving the more general statement, namely that, if Y is a non-negative random variable with finite mean, then E(log Y) log(EY). (b) Prove that, in fact, there is strict inequality: E(log Y) < log(EY), unless Y is degenerate. (c) Review the proof of Jensen's inequality, Theorem 5.1. Generalize with a glimpse on (b).arrow_forward3. Prove that, for any random variable X, the minimum of E(X - a)² is attained for a = EX. Provedarrow_forward
- 7. Cantelli's inequality. Let X be a random variable with finite variance, o². (a) Prove that, for x ≥ 0, P(X EX2x)≤ 02 x² +0² 202 P(|X - EX2x)<≤ (b) Find X assuming two values where there is equality. (c) When is Cantelli's inequality better than Chebyshev's inequality? (d) Use Cantelli's inequality to show that med (X) - EX ≤ o√√3; recall, from Proposition 6.1, that an application of Chebyshev's inequality yields the bound o√√2. (e) Generalize Cantelli's inequality to moments of order r 1.arrow_forwardThe college hiking club is having a fundraiser to buy new equipment for fall and winter outings. The club is selling Chinese fortune cookies at a price of $2 per cookie. Each cookie contains a piece of paper with a different number written on it. A random drawing will determine which number is the winner of a dinner for two at a local Chinese restaurant. The dinner is valued at $32. Since fortune cookies are donated to the club, we can ignore the cost of the cookies. The club sold 718 cookies before the drawing. Lisa bought 13 cookies. Lisa's expected earnings can be found by multiplying the value of the dinner by the probability that she will win. What are Lisa's expected earnings? Round your answer to the nearest cent.arrow_forwardThe Honolulu Advertiser stated that in Honolulu there was an average of 659 burglaries per 400,000 households in a given year. In the Kohola Drive neighborhood there are 321 homes. Let r be the number of homes that will be burglarized in a year. Use the formula for Poisson distribution. What is the value of p, the probability of success, to four decimal places?arrow_forward
- The college hiking club is having a fundraiser to buy new equipment for fall and winter outings. The club is selling Chinese fortune cookies at a price of $2 per cookie. Each cookie contains a piece of paper with a different number written on it. A random drawing will determine which number is the winner of a dinner for two at a local Chinese restaurant. The dinner is valued at $32. Since fortune cookies are donated to the club, we can ignore the cost of the cookies. The club sold 718 cookies before the drawing. Lisa bought 13 cookies. Lisa's expected earnings can be found by multiplying the value of the dinner by the probability that she will win. What are Lisa's expected earnings? Round your answer to the nearest cent.arrow_forwardWhat was the age distribution of nurses in Great Britain at the time of Florence Nightingale? Thanks to Florence Nightingale and the British census of 1851, we have the following information (based on data from the classic text Notes on Nursing, by Florence Nightingale). Note: In 1851 there were 25,466 nurses in Great Britain. Furthermore, Nightingale made a strict distinction between nurses and domestic servants. Use a histogram and graph the probability distribution. Using the graph of the probability distribution determine the probability that a British nurse selected at random in 1851 would be 40 years of age or older. Round your answer to nearest thousandth. Age range (yr) 20–29 30–39 40–49 50–59 60–69 70–79 80+ Midpoint (x) 24.5 34.5 44.5 54.5 64.5 74.5 84.5 Percent of nurses 5.7% 9.7% 19.5% 29.2% 25.0% 9.1% 1.8%arrow_forwardWhat was the age distribution of nurses in Great Britain at the time of Florence Nightingale? Thanks to Florence Nightingale and the British census of 1851, we have the following information (based on data from the classic text Notes on Nursing, by Florence Nightingale). Note: In 1851 there were 25,466 nurses in Great Britain. Furthermore, Nightingale made a strict distinction between nurses and domestic servants. Use a histogram and graph the probability distribution. Using the graph of the probability distribution determine the probability that a British nurse selected at random in 1851 would be 40 years of age or older. Round your answer to nearest thousandth. Age range (yr) 20–29 30–39 40–49 50–59 60–69 70–79 80+ Midpoint (x) 24.5 34.5 44.5 54.5 64.5 74.5 84.5 Percent of nurses 5.7% 9.7% 19.5% 29.2% 25.0% 9.1% 1.8%arrow_forward
 Big Ideas Math A Bridge To Success Algebra 1: Stu...AlgebraISBN:9781680331141Author:HOUGHTON MIFFLIN HARCOURTPublisher:Houghton Mifflin Harcourt
 Holt Mcdougal Larson Pre-algebra: Student Edition...AlgebraISBN:9780547587776Author:HOLT MCDOUGALPublisher:HOLT MCDOUGAL
 Glencoe Algebra 1, Student Edition, 9780079039897...AlgebraISBN:9780079039897Author:CarterPublisher:McGraw Hill