Figure 2-26 shows a grade report that is mailed to students at the end of each semester. Prepare an ERD reflecting the data contained in the grade report. Assume that each course is taught by one instructor. Also, draw this data model using the tool you have been told to use in the course. Explain what you chose for the identifier of each entity type on your ERD.
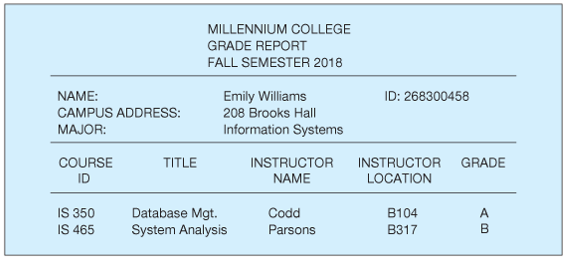
Figure 2-26 Grade report
Trending nowThis is a popular solution!
Learn your wayIncludes step-by-step video

Chapter 2 Solutions
Modern Database Management (12th Edition)
Additional Engineering Textbook Solutions
Elementary Surveying: An Introduction To Geomatics (15th Edition)
Starting Out with C++ from Control Structures to Objects (9th Edition)
Starting Out with Programming Logic and Design (5th Edition) (What's New in Computer Science)
Java How to Program, Early Objects (11th Edition) (Deitel: How to Program)
SURVEY OF OPERATING SYSTEMS
Starting Out with Java: From Control Structures through Objects (7th Edition) (What's New in Computer Science)
- Suppose that the MinGap method below is added to the Treap class on Blackboard. public int MinGap( ) Returns the absolute difference between the two closest numbers in the treap. For example, if the numbers are {2, 5, 7, 11, 12, 15, 20} then MinGap would returns 1, the absolute difference between 11 and 12. Requirements 1. Describe in a separate Design Document what additional data is needed and how that data is used to support an time complexity of O(1) for the MinGap method. Show as well that the methods Add and Remove can efficiently maintain this data as items are added and removed. (6 marks) 2. Re-implement the methods Add and Remove of the Treap class to maintain the augmented data in expected O(log n) time. (6 marks) 3. Implement the MinGap method. (4 marks) 4. Test your new method thoroughly. Include your test cases and results in a Test Document. (4 marks)arrow_forwardSuppose that the two Rank methods below are added to the Skip List class on Blackboard. public int Rank(T item) Returns the rank of the given item. public T Rank(int i) Returns the item with the given rank i. Requirements 1. Describe in a separate Design Document what additional data is needed and how that data is used to support an expected time complexity of O(log n) for each of the Rank methods. Show as well that the methods Insert and Remove can efficiently maintain this data as items are inserted and removed. (7 marks) 2. Re-implement the methods Insert and Remove of the Skip List class to maintain the augmented data in expected O(log n) time. Using the Contains method, ensure that added items are distinct. (6 marks) 3. Implement the two Rank methods. (8 marks) 4. Test your new methods thoroughly. Include your test cases and results in a Test Document. (4 marks)arrow_forwardhttps://docs.google.com/document/d/1lk0DgaWfVezagyjAEskyPoe9Ciw3J2XUH_HQfnWSmwU/edit?usp=sharing use the link to answer the question below b) As part of your listed data elements, define the following metadata for each: Data/FieldType, Field Size, and any possible constraint/s or needed c) Identify and describe the relationship/s among the tables. Please provide an example toillustrate Referential Integrity and explain why it is essential for data credibility. I have inserted the data elements below for referencearrow_forward
- Highlight the main differences between Computer Assisted Coding and Alone Coding with their similaritiesarrow_forwardSuppose that the MinGap method below is added to the Treap class on Blackboard. public int MinGap ( ) Returns the absolute difference between the two closest numbers in the treap. For example, if the numbers are {2, 5, 7, 11, 12, 15, 20} then MinGap would returns 1, the absolute difference between 11 and 12. Requirements 1. Describe in a separate Design Document what additional data is needed and how that data is used to support an time complexity of O(1) for the MinGap method. Show as well that the methods Add and Remove can efficiently maintain this data as items are added and removed. (6 marks) 2. Re-implement the methods Add and Remove of the Treap class to maintain the augmented data in expected O(log n) time. (6 marks) 3. Implement the MinGap method. (4 marks) 4. Test your new method thoroughly. Include your test cases and results in a Test Document. (4 marks)arrow_forwardSuppose that the two Rank methods below are added to the Skip List class on Blackboard. public int Rank (T item) Returns the rank of the given item. public T Rank(int i) Returns the item with the given rank i. Requirements 1. Describe in a separate Design Document what additional data is needed and how that data is used to support an expected time complexity of O(log n) for each of the Rank methods. Show as well that the methods Insert and Remove can efficiently maintain this data as items are inserted and removed. (7 marks) 2. Re-implement the methods Insert and Remove of the Skip List class to maintain the augmented data in expected O(log n) time. Using the Contains method, ensure that added items are distinct. (6 marks) 3. Implement the two Rank methods. (8 marks) 4. Test your new methods thoroughly. Include your test cases and results in a Test Document. (4 marks)arrow_forward
- Suppose that the two Rank methods below are added to the Skip List class on Blackboard. public int Rank (T item) Returns the rank of the given item. public T Rank(int i) Returns the item with the given rank i. Requirements 1. Describe in a separate Design Document what additional data is needed and how that data is used to support an expected time complexity of O(log n) for each of the Rank methods. Show as well that the methods Insert and Remove can efficiently maintain this data as items are inserted and removed. (7 marks) 2. Re-implement the methods Insert and Remove of the Skip List class to maintain the augmented data in expected O(log n) time. Using the Contains method, ensure that added items are distinct. (6 marks) 3. Implement the two Rank methods. (8 marks) 4. Test your new methods thoroughly. Include your test cases and results in a Test Document. (4 marks)arrow_forwardautomata theoryarrow_forwardI need help in construct a matlab code to find the voltage, the currents, and the watts based on that circuit.arrow_forward
- Objective Implement Bottom-Up Iterative MergeSort and analyze its efficiency compared to recursive MergeSort. Unlike the recursive approach, which involves multiple function calls and stack overhead, the bottom-up version sorts iteratively by merging small subarrays first, reducing recursion depth and improving performance. Task 1. Implement Bottom-Up Iterative MergeSort о Start with single-element subarrays and iteratively merge them into larger sorted sections. Use a loop-based merging process instead of recursion. ○ Implement an efficient in-place merging strategy if possible. 2. Performance Analysis Compare execution time with recursive MergeSort on random, nearly sorted, and reversed datasets. ○ Measure and plot time complexity vs. input size. O Submission Explain why the iterative version reduces function call overhead and when it performs better. • Code implementation with comments. • A short report (1-2 pages) comparing performance. • Graph of execution time vs. input size for…arrow_forwardGiven a shared data set, we allow multiple readers to read at the same time, and only one single writer can access the shared data at the same time. In the lecture slides, a solution is given. However, the problem is that the write cannot write forever, if there are always at least one reader. How to ensure that the writer can eventually write? Propose your solution by using semaphores and implemented in Python from threading import Thread, Semaphore from time import sleep from sys import stdout class Reader(Thread): def__init__(self, name): self.n=name; Thread.__init__(self) defrun(self): globalnr, nw, dr, dw whileTrue: # ⟨await nw == 0 then nr += 1⟩ e.acquire() ifnw>0: #if nw > 0 or dw > 0 : dr+=1; e.release(); r.acquire() nr+=1 ifdr>0: dr-=1; r.release() else: e.release() # read data stdout.write(self.n+' reading\n') sleep(1) # ⟨nr -= 1⟩ e.acquire() nr-=1 ifnr==0anddw>0: dw-=1 ; w.release() else: e.release() class Writer(Thread): def__init__(self, name):…arrow_forwardAnnée scolaire: 2024/2025 Collège SMARA Devoir à domicile 1 semestre 2 Prof: NILAJ PHYSIQUE CHIMIE Nom et Prénom: Niveau: 3APIC Exercice 1: Durée: 1 heure 1) Donner la définition des termes suivantes? Le Mouvement : La vitesse moyenne: 2) Répondre par « Vrai » ou «> Un objet peut être en mouvement et au repos Si la vitesse est constante, le mouvement sera uniforme. 3) Compléter les phrases par les termes qui conviennent : Pour déterminer le mouvement ou le repos d'un objet, vous devez choisir un autre objet appelé le d'un point d'un corps mobile est l'ensemble des positions qu'il occupe durant son mouvement. Il y a trois types de trajectoires: circulaire. La distance de freinage dépend de 4) Cocher la bonne réponse? > La relation entre la vitesse, la distance et le temps: d Vm = dxt > L'unité internationale de la vitesse moyenne est : m/s 5) On considère la figure suivante : Compléter le tableau par les mots suivants : En mouvement au repos A C Km/h et et l' m. s-1 15 A B C Sol…arrow_forward

 A Guide to SQLComputer ScienceISBN:9781111527273Author:Philip J. PrattPublisher:Course Technology Ptr
 Database Systems: Design, Implementation, & Manag...Computer ScienceISBN:9781305627482Author:Carlos Coronel, Steven MorrisPublisher:Cengage Learning
 Database Systems: Design, Implementation, & Manag...Computer ScienceISBN:9781285196145Author:Steven, Steven Morris, Carlos Coronel, Carlos, Coronel, Carlos; Morris, Carlos Coronel and Steven Morris, Carlos Coronel; Steven Morris, Steven Morris; Carlos CoronelPublisher:Cengage Learning
 Principles of Information Systems (MindTap Course...Computer ScienceISBN:9781285867168Author:Ralph Stair, George ReynoldsPublisher:Cengage Learning
 Principles of Information Systems (MindTap Course...Computer ScienceISBN:9781305971776Author:Ralph Stair, George ReynoldsPublisher:Cengage Learning


