EBK BUSINESS STATISTICS
8th Edition
ISBN: 9780135179833
Author: STEPHAN
Publisher: VST
expand_more
expand_more
format_list_bulleted
Concept explainers
Videos
Textbook Question
Chapter 2, Problem 2.2LB
The following data represent the responses to two questions asked in a survey of 40 college Students majoring in business. What IS your gender? (M male; F female), and What is your major?
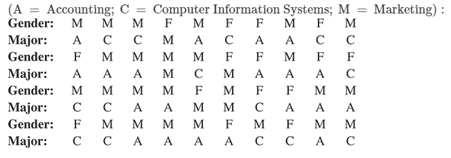
- Tally the data into a
contingency table where the two rows represent the gender categories and the three columns represent the academic major categories. - Construct contingency tables based on percentages of all 40 student responses, based on row percentages and based on column percentages.
Expert Solution & Answer
Want to see the full answer?
Check out a sample textbook solution
Students have asked these similar questions
Examine the Variables: Carefully review and note the names of all variables in the dataset. Examples of these variables include:
Mileage (mpg)
Number of Cylinders (cyl)
Displacement (disp)
Horsepower (hp)
Research: Google to understand these variables.
Statistical Analysis: Select mpg variable, and perform the following statistical tests. Once you are done with these tests using mpg variable, repeat the same with hp
Mean
Median
First Quartile (Q1)
Second Quartile (Q2)
Third Quartile (Q3)
Fourth Quartile (Q4)
10th Percentile
70th Percentile
Skewness
Kurtosis
Document Your Results:
In RStudio: Before running each statistical test, provide a heading in the format shown at the bottom. “# Mean of mileage – Your name’s command”
In Microsoft Word: Once you've completed all tests, take a screenshot of your results in RStudio and paste it into a Microsoft Word document. Make sure that snapshots are very clear. You will need multiple snapshots. Also transfer these results to the…
2 (VaR and ES) Suppose X1
are independent. Prove that
~
Unif[-0.5, 0.5] and X2
VaRa (X1X2) < VaRa(X1) + VaRa (X2).
~
Unif[-0.5, 0.5]
8 (Correlation and Diversification)
Assume we have two stocks, A and B, show that a particular combination
of the two stocks produce a risk-free portfolio when the correlation between
the return of A and B is -1.
Chapter 2 Solutions
EBK BUSINESS STATISTICS
Ch. 2 - Prob. 2.1LBCh. 2 - The following data represent the responses to two...Ch. 2 - Prob. 2.3ACCh. 2 - Prob. 2.5ACCh. 2 - Prob. 2.6ACCh. 2 - Prob. 2.7ACCh. 2 - Prob. 2.8ACCh. 2 - Prob. 2.10ACCh. 2 - Prob. 2.11LBCh. 2 - Prob. 2.12LB
Ch. 2 - Prob. 2.14LBCh. 2 - The file UTILITY contains the following data about...Ch. 2 - One operation of a mill to cut pieces of steel...Ch. 2 - Prob. 2.21ACCh. 2 - Prob. 2.23ACCh. 2 - Prob. 2.25ACCh. 2 - Prob. 2.26ACCh. 2 - The following table indicates the percentage of...Ch. 2 - Prob. 2.29ACCh. 2 - Prob. 2.30ACCh. 2 - Prob. 2.31ACCh. 2 - Prob. 2.32ACCh. 2 - Prob. 2.33LBCh. 2 - Prob. 2.34LBCh. 2 - Prob. 2.35ACCh. 2 - The file UTILITY contains the following data about...Ch. 2 - Prob. 2.39ACCh. 2 - Prob. 2.43ACCh. 2 - The data stored in DRINK represents the amount of...Ch. 2 - Prob. 2.48LBCh. 2 - Prob. 2.49LBCh. 2 - Prob. 2.50ACCh. 2 - Data were collected on the typical cost of dining...Ch. 2 - Prob. 2.53ACCh. 2 - Prob. 2.54ACCh. 2 - Prob. 2.55ACCh. 2 - Prob. 2.56ACCh. 2 - Using the sample of retirement funds stored in...Ch. 2 - Prob. 2.59ACCh. 2 - Using the sample of retirement funds stored in...Ch. 2 - Using the sample of retirement funds stored in...Ch. 2 - Prob. 2.62ACCh. 2 - Prob. 2.70ACCh. 2 - Prob. 2.71ACCh. 2 - Prob. 2.72ACCh. 2 - Prob. 2.73ACCh. 2 - Prob. 2.75ACCh. 2 - Prob. 2.76ACCh. 2 - Prob. 2.77CYUCh. 2 - Prob. 2.78CYUCh. 2 - What are the advantages and disadvantages of using...Ch. 2 - Compare and contrast the bar chart for categorical...Ch. 2 - Prob. 2.81CYUCh. 2 - Prob. 2.82CYUCh. 2 - What are the three different ways to break down...Ch. 2 - How can a multidimensional table differ from a...Ch. 2 - Prob. 2.85CYUCh. 2 - Prob. 2.89CRPCh. 2 - The owner of a restaurant that serves...Ch. 2 - Suppose that the owner of the restaurant in...Ch. 2 - Prob. 2.94CRPCh. 2 - One of the major measures of the quality of...Ch. 2 - Prob. 2.103CRPCh. 2 - Prob. 2.104CRPCh. 2 - Prob. 2.105CRPCh. 2 - Prob. 2.109RWE
Knowledge Booster


Learn more about
Need a deep-dive on the concept behind this application? Look no further. Learn more about this topic, statistics and related others by exploring similar questions and additional content below.Similar questions
- 9 (Portfolio allocation) Suppose R₁ and R2 are returns of 2 assets and with expected return and variance respectively r₁ and 72 and variance-covariance σ2, 0%½ and σ12. Find −∞ ≤ w ≤ ∞ such that the portfolio wR₁ + (1 - w) R₂ has the smallest risk.arrow_forward7 (Multivariate random variable) Suppose X, €1, €2, €3 are IID N(0, 1) and Y2 Y₁ = 0.2 0.8X + €1, Y₂ = 0.3 +0.7X+ €2, Y3 = 0.2 + 0.9X + €3. = (In models like this, X is called the common factors of Y₁, Y₂, Y3.) Y = (Y1, Y2, Y3). (a) Find E(Y) and cov(Y). (b) What can you observe from cov(Y). Writearrow_forward1 (VaR and ES) Suppose X ~ f(x) with 1+x, if 0> x > −1 f(x) = 1−x if 1 x > 0 Find VaRo.05 (X) and ES0.05 (X).arrow_forward
- Joy is making Christmas gifts. She has 6 1/12 feet of yarn and will need 4 1/4 to complete our project. How much yarn will she have left over compute this solution in two different ways arrow_forwardSolve for X. Explain each step. 2^2x • 2^-4=8arrow_forwardOne hundred people were surveyed, and one question pertained to their educational background. The results of this question and their genders are given in the following table. Female (F) Male (F′) Total College degree (D) 30 20 50 No college degree (D′) 30 20 50 Total 60 40 100 If a person is selected at random from those surveyed, find the probability of each of the following events.1. The person is female or has a college degree. Answer: equation editor Equation Editor 2. The person is male or does not have a college degree. Answer: equation editor Equation Editor 3. The person is female or does not have a college degree.arrow_forward
- At the same restaurant as in Question 19 with the same normal distribution, what's the chance of it taking no more than 15 minutes to get service?arrow_forwardClint, obviously not in college, sleeps an average of 8 hours per night with a standard deviation of 15 minutes. What's the chance of him sleeping between 7.5 and 8.5 hours on any given night? 0-(7-0) 200 91109s and doiw $20 (8-0) mol 8520 slang $199 galbrog seam side pide & D (newid se od poyesvig as PELEO PER AFTE editiw noudab temand van Czarrow_forwardTimes to complete a statistics exam have a normal distribution with a mean of 40 minutes and standard deviation of 6 minutes. Deshawn's time comes in at the 90th percentile. What percentage of the students are still working on their exams when Deshawn leaves?arrow_forward
arrow_back_ios
SEE MORE QUESTIONS
arrow_forward_ios
Recommended textbooks for you
 Holt Mcdougal Larson Pre-algebra: Student Edition...AlgebraISBN:9780547587776Author:HOLT MCDOUGALPublisher:HOLT MCDOUGAL
 Glencoe Algebra 1, Student Edition, 9780079039897...AlgebraISBN:9780079039897Author:CarterPublisher:McGraw Hill
 Big Ideas Math A Bridge To Success Algebra 1: Stu...AlgebraISBN:9781680331141Author:HOUGHTON MIFFLIN HARCOURTPublisher:Houghton Mifflin Harcourt
Holt Mcdougal Larson Pre-algebra: Student Edition...
Algebra
ISBN:9780547587776
Author:HOLT MCDOUGAL
Publisher:HOLT MCDOUGAL
Glencoe Algebra 1, Student Edition, 9780079039897...
Algebra
ISBN:9780079039897
Author:Carter
Publisher:McGraw Hill
Big Ideas Math A Bridge To Success Algebra 1: Stu...
Algebra
ISBN:9781680331141
Author:HOUGHTON MIFFLIN HARCOURT
Publisher:Houghton Mifflin Harcourt
Which is the best chart: Selecting among 14 types of charts Part II; Author: 365 Data Science;https://www.youtube.com/watch?v=qGaIB-bRn-A;License: Standard YouTube License, CC-BY