
EBK BUSINESS STATISTICS
7th Edition
ISBN: 9780134462783
Author: STEPHAN
Publisher: PEARSON CUSTOM PUB.(CONSIGNMENT)
expand_more
expand_more
format_list_bulleted
Videos
Textbook Question
Chapter 2, Problem 2.104CRP
The following data (stored in Drink) represent the amount of soft drink in a sample of 50 consecutively filled 2-liter bottles. The results are listed horizontally in the order of being filled:
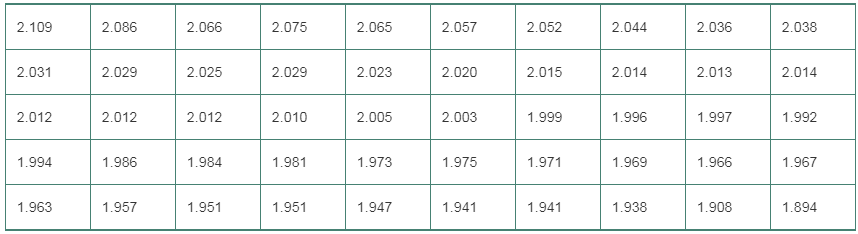
- Construct a time-series plot for the amount of soft drink on the Y axis and the bottle number (going consecutively from 1 to 50) on the X axis.
- What pattern, if any, is present in these data?
- If you had to make a prediction about the amount of soft drink filled in the next bottle, what would you predict?
- Based on the results of (a) through (c), explain why it is important to construct a time-series plot and not just a histogram, as was done in Problem 2.47 on page 59.
Expert Solution & Answer
Want to see the full answer?
Check out a sample textbook solution
Students have asked these similar questions
Business
3. Bayesian Inference – Updating Beliefs
A medical test for a rare disease has the following characteristics:
Sensitivity (true positive rate): 99%
Specificity (true negative rate): 98%
The disease occurs in 0.5% of the population.
A patient receives a positive test result.
Questions:
a) Define the relevant events and use Bayes’ Theorem to compute the probability that the patient actually has the disease.b) Explain why the result might seem counterintuitive, despite the high sensitivity and specificity.c) Discuss how prior probabilities influence posterior beliefs in Bayesian inference.d) Suppose a second, independent test with the same accuracy is conducted and is also positive. Update the probability that the patient has the disease.
4. Linear Regression - Model Assumptions and Interpretation
A real estate analyst is studying how house prices (Y) are related to house size in square feet (X). A simple
linear regression model is proposed:
The analyst fits the model and obtains:
•
Ŷ50,000+150X
YBoB₁X + €
•
R² = 0.76
• Residuals show a fan-shaped pattern when plotted against fitted values.
Questions:
a) Interpret the slope coefficient in context.
b) Explain what the R² value tells us about the model's performance.
c) Based on the residual pattern, what regression assumption is likely violated? What might be the
consequence?
d) Suggest at least two remedies to improve the model, based on the residual analysis.
Chapter 2 Solutions
EBK BUSINESS STATISTICS
Ch. 2 - Prob. 2.1LBCh. 2 - The following data represent the responses to two...Ch. 2 - Prob. 2.3ACCh. 2 - Prob. 2.4ACCh. 2 - Prob. 2.5ACCh. 2 - Prob. 2.6ACCh. 2 - Prob. 2.7ACCh. 2 - A survey of 1,085 adults asked Do you enjoy...Ch. 2 - Prob. 2.9ACCh. 2 - Prob. 2.10AC
Ch. 2 - Prob. 2.11LBCh. 2 - Prob. 2.12LBCh. 2 - Prob. 2.13LBCh. 2 - Prob. 2.14LBCh. 2 - The file NBACost2013 contains the total cost ($)...Ch. 2 - The file UTILITY contains the following data about...Ch. 2 - Prob. 2.17ACCh. 2 - One operation of a mill to cut pieces of steel...Ch. 2 - A manufacturing company produces steel housings...Ch. 2 - Prob. 2.21ACCh. 2 - Prob. 2.22ACCh. 2 - Prob. 2.23ACCh. 2 - An online survey of CFA Institute members was...Ch. 2 - Prob. 2.25ACCh. 2 - Prob. 2.26ACCh. 2 - Prob. 2.27ACCh. 2 - The following table indicates the percentage of...Ch. 2 - Prob. 2.29ACCh. 2 - Prob. 2.30ACCh. 2 - A study of Kickstarter projects showed that 54.2%...Ch. 2 - Prob. 2.32ACCh. 2 - Prob. 2.33LBCh. 2 - Prob. 2.34LBCh. 2 - Prob. 2.35ACCh. 2 - Prob. 2.37ACCh. 2 - The file UTILITY contains the following data about...Ch. 2 - Prob. 2.39ACCh. 2 - Prob. 2.40ACCh. 2 - Prob. 2.41ACCh. 2 - Prob. 2.42ACCh. 2 - Prob. 2.43ACCh. 2 - Prob. 2.45ACCh. 2 - Prob. 2.46ACCh. 2 - The data stored in DRINK represents the amount of...Ch. 2 - Prob. 2.48LBCh. 2 - Prob. 2.49LBCh. 2 - Prob. 2.50ACCh. 2 - Data were collected on the typical cost of dining...Ch. 2 - College football is big business, with coaches pay...Ch. 2 - Prob. 2.54ACCh. 2 - Prob. 2.56ACCh. 2 - Prob. 2.57ACCh. 2 - Prob. 2.58ACCh. 2 - Prob. 2.59ACCh. 2 - Prob. 2.60ACCh. 2 - Prob. 2.61ACCh. 2 - Prob. 2.66ACCh. 2 - Prob. 2.67ACCh. 2 - Prob. 2.68ACCh. 2 - Prob. 2.69ACCh. 2 - Prob. 2.71ACCh. 2 - (Student Project) The Data and Story Library...Ch. 2 - Prob. 2.73ACCh. 2 - Prob. 2.75ACCh. 2 - Figure 2.1 shows a bar chart and a pie chart for...Ch. 2 - Prob. 2.78ACCh. 2 - Prob. 2.79CYUCh. 2 - Prob. 2.80CYUCh. 2 - Prob. 2.81CYUCh. 2 - Compare and contrast the bar chart for categorical...Ch. 2 - Prob. 2.83CYUCh. 2 - Prob. 2.84CYUCh. 2 - What are the three different ways to break down...Ch. 2 - How can a multidimensional table differ from a...Ch. 2 - Prob. 2.87CYUCh. 2 - Prob. 2.88CRPCh. 2 - The owner of a restaurant that serves...Ch. 2 - Suppose that the owner of the restaurant in...Ch. 2 - Prob. 2.94CRPCh. 2 - One of the major measures of the quality of...Ch. 2 - Prob. 2.98CRPCh. 2 - The file CEO-Compensation includes the total...Ch. 2 - Prob. 2.100CRPCh. 2 - What was the average price of a room at two-star,...Ch. 2 - Prob. 2.102CRPCh. 2 - Prob. 2.103CRPCh. 2 - The following data (stored in Drink) represent...Ch. 2 - Prob. 2.106CRPCh. 2 - Prob. 2.109RWE
Additional Math Textbook Solutions
Find more solutions based on key concepts
(a) Make a stem-and-leaf plot for these 24 observations on the number of customers who used a down-town CitiBan...
APPLIED STAT.IN BUS.+ECONOMICS
1. How is a sample related to a population?
Elementary Statistics: Picturing the World (7th Edition)
Empirical versus Theoretical A Monopoly player claims that the probability of getting a 4 when rolling a six-si...
Introductory Statistics
Find all solutions of each equation in the interval .
Precalculus: A Unit Circle Approach (3rd Edition)
The largest polynomial that divides evenly into a list of polynomials is called the _______.
Elementary & Intermediate Algebra
Provide an example of a qualitative variable and an example of a quantitative variable.
Elementary Statistics ( 3rd International Edition ) Isbn:9781260092561
Knowledge Booster


Learn more about
Need a deep-dive on the concept behind this application? Look no further. Learn more about this topic, statistics and related others by exploring similar questions and additional content below.Similar questions
- 5. Probability Distributions – Continuous Random Variables A factory machine produces metal rods whose lengths (in cm) follow a continuous uniform distribution on the interval [98, 102]. Questions: a) Define the probability density function (PDF) of the rod length.b) Calculate the probability that a randomly selected rod is shorter than 99 cm.c) Determine the expected value and variance of rod lengths.d) If a sample of 25 rods is selected, what is the probability that their average length is between 99.5 cm and 100.5 cm? Justify your answer using the appropriate distribution.arrow_forward2. Hypothesis Testing - Two Sample Means A nutritionist is investigating the effect of two different diet programs, A and B, on weight loss. Two independent samples of adults were randomly assigned to each diet for 12 weeks. The weight losses (in kg) are normally distributed. Sample A: n = 35, 4.8, s = 1.2 Sample B: n=40, 4.3, 8 = 1.0 Questions: a) State the null and alternative hypotheses to test whether there is a significant difference in mean weight loss between the two diet programs. b) Perform a hypothesis test at the 5% significance level and interpret the result. c) Compute a 95% confidence interval for the difference in means and interpret it. d) Discuss assumptions of this test and explain how violations of these assumptions could impact the results.arrow_forward1. Sampling Distribution and the Central Limit Theorem A company produces batteries with a mean lifetime of 300 hours and a standard deviation of 50 hours. The lifetimes are not normally distributed—they are right-skewed due to some batteries lasting unusually long. Suppose a quality control analyst selects a random sample of 64 batteries from a large production batch. Questions: a) Explain whether the distribution of sample means will be approximately normal. Justify your answer using the Central Limit Theorem. b) Compute the mean and standard deviation of the sampling distribution of the sample mean. c) What is the probability that the sample mean lifetime of the 64 batteries exceeds 310 hours? d) Discuss how the sample size affects the shape and variability of the sampling distribution.arrow_forward
- A biologist is investigating the effect of potential plant hormones by treating 20 stem segments. At the end of the observation period he computes the following length averages: Compound X = 1.18 Compound Y = 1.17 Based on these mean values he concludes that there are no treatment differences. 1) Are you satisfied with his conclusion? Why or why not? 2) If he asked you for help in analyzing these data, what statistical method would you suggest that he use to come to a meaningful conclusion about his data and why? 3) Are there any other questions you would ask him regarding his experiment, data collection, and analysis methods?arrow_forwardBusinessarrow_forwardWhat is the solution and answer to question?arrow_forward
- To: [Boss's Name] From: Nathaniel D Sain Date: 4/5/2025 Subject: Decision Analysis for Business Scenario Introduction to the Business Scenario Our delivery services business has been experiencing steady growth, leading to an increased demand for faster and more efficient deliveries. To meet this demand, we must decide on the best strategy to expand our fleet. The three possible alternatives under consideration are purchasing new delivery vehicles, leasing vehicles, or partnering with third-party drivers. The decision must account for various external factors, including fuel price fluctuations, demand stability, and competition growth, which we categorize as the states of nature. Each alternative presents unique advantages and challenges, and our goal is to select the most viable option using a structured decision-making approach. Alternatives and States of Nature The three alternatives for fleet expansion were chosen based on their cost implications, operational efficiency, and…arrow_forwardBusinessarrow_forwardWhy researchers are interested in describing measures of the center and measures of variation of a data set?arrow_forward
- WHAT IS THE SOLUTION?arrow_forwardThe following ordered data list shows the data speeds for cell phones used by a telephone company at an airport: A. Calculate the Measures of Central Tendency from the ungrouped data list. B. Group the data in an appropriate frequency table. C. Calculate the Measures of Central Tendency using the table in point B. 0.8 1.4 1.8 1.9 3.2 3.6 4.5 4.5 4.6 6.2 6.5 7.7 7.9 9.9 10.2 10.3 10.9 11.1 11.1 11.6 11.8 12.0 13.1 13.5 13.7 14.1 14.2 14.7 15.0 15.1 15.5 15.8 16.0 17.5 18.2 20.2 21.1 21.5 22.2 22.4 23.1 24.5 25.7 28.5 34.6 38.5 43.0 55.6 71.3 77.8arrow_forwardII Consider the following data matrix X: X1 X2 0.5 0.4 0.2 0.5 0.5 0.5 10.3 10 10.1 10.4 10.1 10.5 What will the resulting clusters be when using the k-Means method with k = 2. In your own words, explain why this result is indeed expected, i.e. why this clustering minimises the ESS map.arrow_forward
arrow_back_ios
SEE MORE QUESTIONS
arrow_forward_ios
Recommended textbooks for you
 Big Ideas Math A Bridge To Success Algebra 1: Stu...AlgebraISBN:9781680331141Author:HOUGHTON MIFFLIN HARCOURTPublisher:Houghton Mifflin Harcourt
 Glencoe Algebra 1, Student Edition, 9780079039897...AlgebraISBN:9780079039897Author:CarterPublisher:McGraw Hill
 Holt Mcdougal Larson Pre-algebra: Student Edition...AlgebraISBN:9780547587776Author:HOLT MCDOUGALPublisher:HOLT MCDOUGAL
 Trigonometry (MindTap Course List)TrigonometryISBN:9781337278461Author:Ron LarsonPublisher:Cengage Learning
 Functions and Change: A Modeling Approach to Coll...AlgebraISBN:9781337111348Author:Bruce Crauder, Benny Evans, Alan NoellPublisher:Cengage Learning
Big Ideas Math A Bridge To Success Algebra 1: Stu...
Algebra
ISBN:9781680331141
Author:HOUGHTON MIFFLIN HARCOURT
Publisher:Houghton Mifflin Harcourt
Glencoe Algebra 1, Student Edition, 9780079039897...
Algebra
ISBN:9780079039897
Author:Carter
Publisher:McGraw Hill
Holt Mcdougal Larson Pre-algebra: Student Edition...
Algebra
ISBN:9780547587776
Author:HOLT MCDOUGAL
Publisher:HOLT MCDOUGAL
Trigonometry (MindTap Course List)
Trigonometry
ISBN:9781337278461
Author:Ron Larson
Publisher:Cengage Learning
Functions and Change: A Modeling Approach to Coll...
Algebra
ISBN:9781337111348
Author:Bruce Crauder, Benny Evans, Alan Noell
Publisher:Cengage Learning
Time Series Analysis Theory & Uni-variate Forecasting Techniques; Author: Analytics University;https://www.youtube.com/watch?v=_X5q9FYLGxM;License: Standard YouTube License, CC-BY
Operations management 101: Time-series, forecasting introduction; Author: Brandoz Foltz;https://www.youtube.com/watch?v=EaqZP36ool8;License: Standard YouTube License, CC-BY