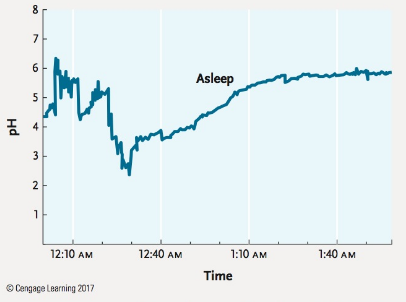
The pH of human stomach acid ranges from 1.0 to 3.0, whereas a healthy esophagus has a pH of approximately 7.0. In gastroesophageal reflux disease (GERD), often called acid reflux, stomach acid flows backward from the stomach into the esophagus. Repeated episodes in which esophageal pH goes below 4.0, considered clinical acid reflux, can result in bleeding ulcers and damage to the esophageal lining. The data in the Figure, from a patient with GERD, show esophageal pH during a sleeping reflux event.

How many minutes does it take to go from the peak of the reflux event (when pH is most acidic) to when the reflux event is over?
Source: Based on T. Demeester et al. 1976. Patterns of gastroesophageal reflux in health and disease. Annals of Surgery 184:459–469.
Want to see the full answer?
Check out a sample textbook solution
Chapter 2 Solutions
Biology: The Dynamic Science
- Use the relationships you just described to compute the values needed to fill in the blanks in the table in Fig A1.4.1 depth (a) 1.0 cml 0.7 cml cm| base dimensions (b, c)| 1.0 cm| 1.0 cm| 1.0 cm 1.0 cm| 1.0 cm| 1.0 cm volume (V) 1.0_cm' cm'| cm'| density (p) 1.0 g/cm'| 1.0 g/cm 1.0 g/cm' mass (m)| 0.3 g Column 1: depth at 1.0 cm volume mass Column 2: depth at 0.7 cm volume mass Column 3: unknown depth depth volumearrow_forwardSan Andreas Transform Boundary Plate Motion The geologic map below of southern California shows the position of the famous San Andreas Fault, a transform plate boundary between the North American Plate (east side) and the Pacific Plate (west side). The relative motion between the plates is indicated by the half arrows along the transform plate boundary (i.e., the Pacific Plate is moving to the northwest relative to the North American Plate). Note the two bodies of Oligocene volcanic rocks (labeled Ov) on the map in the previous page located along either side of the San Andreas Fault. These rocks are about 23.5 million years old and were once one body of rock. They have been separated by displacement along the fault. 21. Based on the offset of these volcanic rocks, what is the average annual rate of relative plate motion in cm/yr? SAF lab 2.jpg Group of answer choices 0.67 cm/yr 2 cm/yr 6.7 cm/yr 1.5 cm/yr CALIFORNIA Berkeley San Francisco K Os Q San Andreas Fault Ov…arrow_forwardThese are NOT part of any graded assignment. Are there other examples of synapomorphy. What is it called when the traits retained are similar to ancestors?arrow_forward
- Please hand draw everying. Thank you! Draw a gram positive bacterial cell below. Your cell should have the following parts, labeled: A coccus shape A capsule The gram positive cell wall should have the peptidoglycan labeled, as well as its component parts (NAM, NAG, and teichoic acid) A cell membrane Fimbriae A nucleoid Ribosomes Inclusionsarrow_forwardDraw a gram negative bacterial cell below. Your cell should have the following parts, labeled: A bacillus shape Fimbriae Amphitrichous flagella 2 membranes (outer and inner) The outer membrane should have lipopolysaccharide (LPS) with lipid A and O antigens Periplasmic space The thin peptidoglycan cell wall between the 2 membranes A nucleoid Ribosomes Inclusionsarrow_forwardBacterial species Cell wall type Example: S. mitis Gram positive S. epidermidis H. pylori M. bovis S. marcescens Shape and arrangement Coccus, streptococcus Drawing 0000000arrow_forward
- Draw a gram positive bacterial cell below. Your cell should have the following parts, labeled: A coccus shape A capsule The gram positive cell wall should have the peptidoglycan labeled, as well as its component parts (NAM, NAG, and teichoic acid) A cell membrane Fimbriae A nucleoid Ribosomes Inclusionsarrow_forwardwhat rank is above kingdom? order, class, phylum or domainarrow_forwardin the hierarchy of taconomic categories, with kingdom at the top, what taxon is below classarrow_forward
- Do cats fly without wings ?arrow_forwardLuke recently moved to a new apartment and wants to grow houseplants but isn't sure which room will be the best fit for them. Apply your knowledge of the scientific method to recommend a strategy for Luke to follow when determining the ideal location for houseplants in his new apartment.arrow_forwardA farmer has noticed that his soybean plants produce more beans in some years than others. He claims to always apply the same amount of fertilizer to the plants, but he suspects the difference in crop yield may have something to do with the amount of water the crops receive. The farmer has observed that the soybeans on his farm usually receive between 0 to 0.5 inches of water per day, but he is unsure of the optimal average daily amount of water with which to irrigate. 1. State a question that addresses the farmer’s problem 2. Conduct online research on “soybean crop irrigation" and record a brief summary of the findings 3. Construct a testable hypothesis and record i 4. Design an experiment to test the hypothesis and describe the procedures, variables, and data to be collected 5. What is the purpose of a control group in an experiment? What would the control groups be for each of your designed experiments in this exercise? 6. Describe the data that would be recorded in each of the…arrow_forward
 Biology: The Dynamic Science (MindTap Course List)BiologyISBN:9781305389892Author:Peter J. Russell, Paul E. Hertz, Beverly McMillanPublisher:Cengage Learning
 Human Physiology: From Cells to Systems (MindTap ...BiologyISBN:9781285866932Author:Lauralee SherwoodPublisher:Cengage Learning


