Concept explainers
Videos
(a)
To sketch: The graph of
(a)
Explanation of Solution
The domain of the given function is
Sketch the graph of given function as shown below.
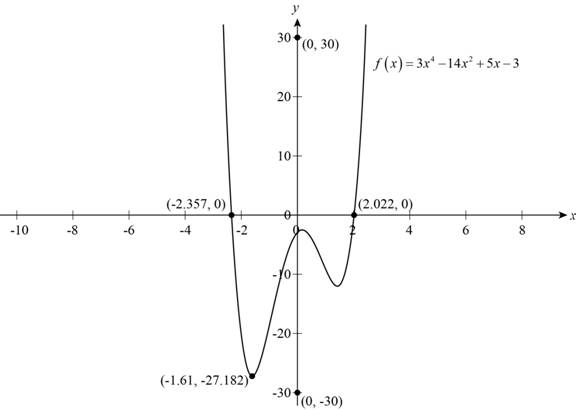
Figure (1)
Above figure shows the graph of function
(b)
To find: The function
(b)
Answer to Problem 12T
The function
Explanation of Solution
To find whether the function is one-to-one or not, draw a horizontal line on the graph of function if it intersects it at more than one point than it is not one-to-one.
Draw the horizontal line on graph of the given function as shown below.
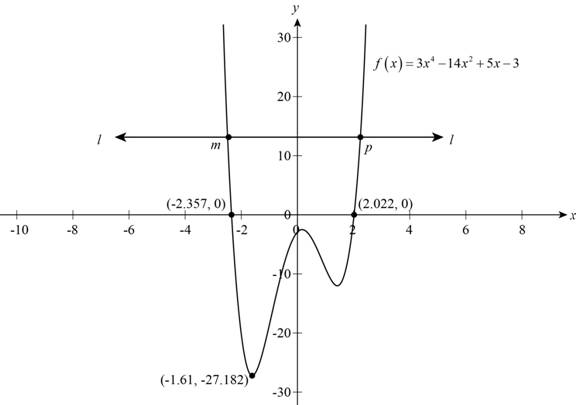
Figure (2)
Observe from Figure (2) that horizontal line l-l intersects the graph of given function at two points m and p.
Thus, the function is not one-to-one.
(c)
To find: The
(c)
Answer to Problem 12T
Local minimum values are
Explanation of Solution
The graph of given function is shown below.
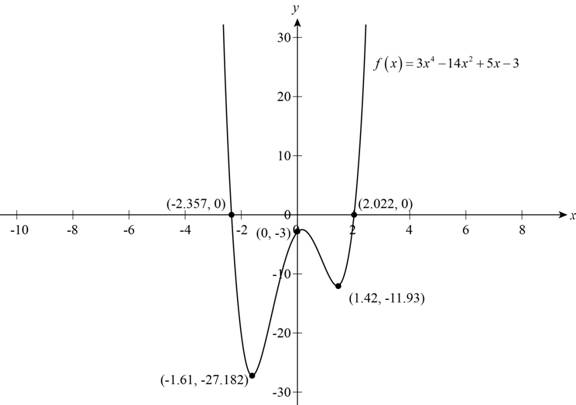
Figure (3)
Any Point a on any curve is called local maximum when
Any point a on any curve is called local minimum when
Observe from Figure (3) that point a and b are local minimum and point c is local minimum.
Coordinates of point
Thus local minimum values are
(d)
To find: The range of the function
(d)
Answer to Problem 12T
The range of given function in set notation is
Explanation of Solution
The graph of given function is shown below.
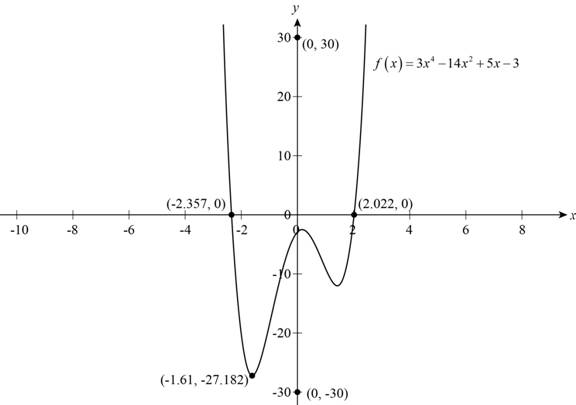
Figure (4)
The minimum value of dependent variable as shown in Figure (4) is
So, the range of given function in set notation is
(e)
To find: The intervals on which function is increasing and decreasing.
(e)
Answer to Problem 12T
Function is increasing in interval
Explanation of Solution
The graph of given function is shown below.
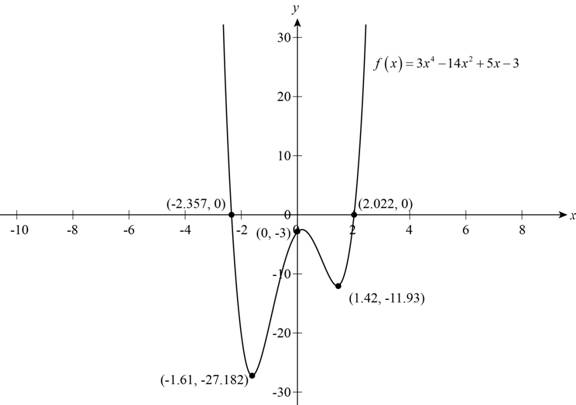
Figure (5)
The function is said to be increasing when its graph is rising and function is said to be decreasing when its graph is falling.
Observe from the graph that it is falling in interval
Thus, the function is increasing in
Chapter 2 Solutions
Precalculus: Mathematics for Calculus - 6th Edition


- Find a plane containing the point (3, -3, 1) and the line of intersection of the planes 2x + 3y - 3z = 14 and -3x - y + z = −21. The equation of the plane is:arrow_forwardDetermine whether the lines L₁ : F(t) = (−2, 3, −1)t + (0,2,-3) and L2 : ƒ(s) = (2, −3, 1)s + (−10, 17, -8) intersect. If they do, find the point of intersection. ● They intersect at the point They are skew lines They are parallel or equalarrow_forwardAnswer questions 2arrow_forward
- How does a fourier transform works?arrow_forwardDetermine the radius of convergence of a power series:12.6.5, 12.6.6, 12.6.7, 12.6.8Hint: Use Theorem12.5.1 and root test, ratio test, integral testarrow_forwardCan you answer this question and give step by step and why and how to get it. Can you write it (numerical method)arrow_forward
- Can you answer this question and give step by step and why and how to get it. Can you write it (numerical method)arrow_forwardThere are three options for investing $1150. The first earns 10% compounded annually, the second earns 10% compounded quarterly, and the third earns 10% compounded continuously. Find equations that model each investment growth and use a graphing utility to graph each model in the same viewing window over a 20-year period. Use the graph to determine which investment yields the highest return after 20 years. What are the differences in earnings among the three investment? STEP 1: The formula for compound interest is A = nt = P(1 + − − ) n², where n is the number of compoundings per year, t is the number of years, r is the interest rate, P is the principal, and A is the amount (balance) after t years. For continuous compounding, the formula reduces to A = Pert Find r and n for each model, and use these values to write A in terms of t for each case. Annual Model r=0.10 A = Y(t) = 1150 (1.10)* n = 1 Quarterly Model r = 0.10 n = 4 A = Q(t) = 1150(1.025) 4t Continuous Model r=0.10 A = C(t) =…arrow_forwardUse a graphing utility to find the point of intersection, if any, of the graphs of the functions. Round your result to three decimal places. (Enter NONE in any unused answer blanks.) y = 100e0.01x (x, y) = y = 11,250 ×arrow_forward
- 5. For the function y-x³-3x²-1, use derivatives to: (a) determine the intervals of increase and decrease. (b) determine the local (relative) maxima and minima. (e) determine the intervals of concavity. (d) determine the points of inflection. (e) sketch the graph with the above information indicated on the graph.arrow_forwardCan you solve this 2 question numerical methodarrow_forward1. Estimate the area under the graph of f(x)-25-x from x=0 to x=5 using 5 approximating rectangles Using: (A) right endpoints. (B) left endpoints.arrow_forward
 Calculus: Early TranscendentalsCalculusISBN:9781285741550Author:James StewartPublisher:Cengage Learning
 Thomas' Calculus (14th Edition)CalculusISBN:9780134438986Author:Joel R. Hass, Christopher E. Heil, Maurice D. WeirPublisher:PEARSON
 Calculus: Early Transcendentals (3rd Edition)CalculusISBN:9780134763644Author:William L. Briggs, Lyle Cochran, Bernard Gillett, Eric SchulzPublisher:PEARSON
 Calculus: Early TranscendentalsCalculusISBN:9781319050740Author:Jon Rogawski, Colin Adams, Robert FranzosaPublisher:W. H. Freeman
 Calculus: Early Transcendental FunctionsCalculusISBN:9781337552516Author:Ron Larson, Bruce H. EdwardsPublisher:Cengage Learning