
Videos
Interpretation A Harm Poll surveyed 2085 U.S. adults regarding use of cell phones while driving. All the adults were asked their opinion regarding how dangerous it is for a driver to use a cell phone while driving. Graph (a) shows the percentage responding "very dangerous" by age group. Only the adults who drive and who have a cell phone were asked how often they talk on the cell phone while driving. Graph (b) shows the percentage responding "never" by age group.
Cell Phone Use and Driving
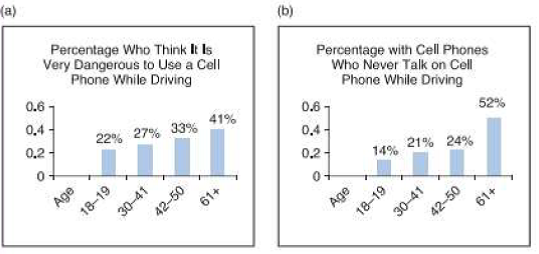
(a) What trend does this survey portray regarding age group and the opinion that using a cell phone while driving is very dangerous?
(b) How does the behavior of never using a cell phone while driving compare to the opinion that using a cell phone while driving is dangerous? Do you think that some of the differences in the behavior (never use a cell phone while driving) and the opinion (using a cell phone while driving is very dangerous) can be attributed to the differences in the survey population? Explain.

Trending nowThis is a popular solution!

Chapter 2 Solutions
Understanding Basic Statistics


- A company found that the daily sales revenue of its flagship product follows a normal distribution with a mean of $4500 and a standard deviation of $450. The company defines a "high-sales day" that is, any day with sales exceeding $4800. please provide a step by step on how to get the answers in excel Q: What percentage of days can the company expect to have "high-sales days" or sales greater than $4800? Q: What is the sales revenue threshold for the bottom 10% of days? (please note that 10% refers to the probability/area under bell curve towards the lower tail of bell curve) Provide answers in the yellow cellsarrow_forwardFind the critical value for a left-tailed test using the F distribution with a 0.025, degrees of freedom in the numerator=12, and degrees of freedom in the denominator = 50. A portion of the table of critical values of the F-distribution is provided. Click the icon to view the partial table of critical values of the F-distribution. What is the critical value? (Round to two decimal places as needed.)arrow_forwardA retail store manager claims that the average daily sales of the store are $1,500. You aim to test whether the actual average daily sales differ significantly from this claimed value. You can provide your answer by inserting a text box and the answer must include: Null hypothesis, Alternative hypothesis, Show answer (output table/summary table), and Conclusion based on the P value. Showing the calculation is a must. If calculation is missing,so please provide a step by step on the answers Numerical answers in the yellow cellsarrow_forward
 Glencoe Algebra 1, Student Edition, 9780079039897...AlgebraISBN:9780079039897Author:CarterPublisher:McGraw Hill
 Big Ideas Math A Bridge To Success Algebra 1: Stu...AlgebraISBN:9781680331141Author:HOUGHTON MIFFLIN HARCOURTPublisher:Houghton Mifflin Harcourt
 Holt Mcdougal Larson Pre-algebra: Student Edition...AlgebraISBN:9780547587776Author:HOLT MCDOUGALPublisher:HOLT MCDOUGAL