Principles Of Economics 2e
2nd Edition
ISBN: 9781680920864
Author: Timothy Taylor, Steven A. Greenlaw, David Shapiro
Publisher: MCGRAW-HILL HIGHER EDUCATION
expand_more
expand_more
format_list_bulleted
Textbook Question
Chapter 19, Problem 4SCQ
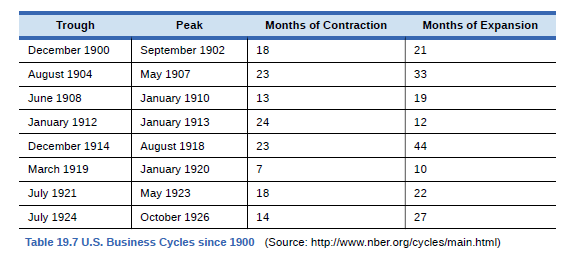
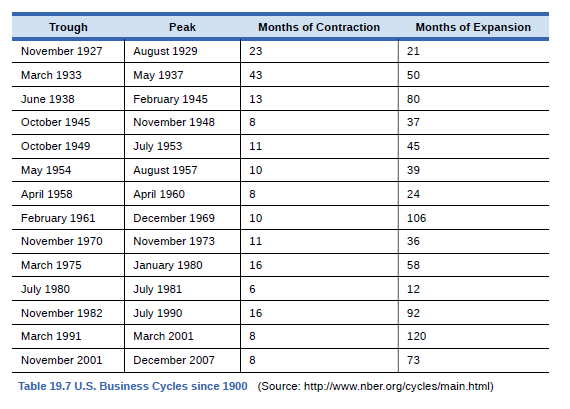
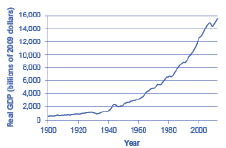
Without looking at Table 19.7, return to Figure 19.10. If we define a recession as a significant decline in national output, can you identify any post-1960 recessions in addition to the


Expert Solution & Answer
Want to see the full answer?
Check out a sample textbook solution
Students have asked these similar questions
Section 1
Answer all questions. Show all your workings.
(a) Suppose there are two firms 1 and 2, whose abatement costs
are given by c₁(e₁) and c₂ (e₂), where e denotes emissions and
subscripts denote the firm.
We assume that c{(e;) 0 for i = 1,2 and for any
level of emission e we have c₁'(e) # c₂'(e).
Furthermore, assume the two firms make different contributions
towards pollution concentration in a nearby river captured by the
transfer coefficients ε₁ and 2 such that for any level of emission
e we have 2(e) +2 The regulator does not know the resulting
C₁'(e) Τι
environmental damages. Using an analytical approach explain
carefully how the regulator may limit the concentration of
pollution using (i) a Pigouvian tax scheme and (ii) uniform
emissions standards. Discuss the cost-effectiveness of both
approaches to control pollution.
[200 marks]
(b) "Whether the regulator sells or gives away tradeable emission
permits free of charge, the quantities of emissions produced by
firms are the…
Exotic Coffee for the Poor? What a Genius Idea!
you are a business consultant at a coffee shop. Your team leader came to you one morning with excitement on her face and told you, "Guess what? I have an idea for a great location for our next coffee shop. Think about it, Riceville is a city that has 150,000 people. Most of them are above the age of 16, which means they are potential coffee drinkers. Well, even though the majority of people in that city are making minimum wage and are considered poor, but the good news is that there are no coffee shops in Riceville and the only places you could get coffee there either restaurants or gas stations. What do you think?"
Knowing that your company’s average drink price is $5.50, and the stores have nice sit-down areas and offer free WIFI and study spaces:
What type of information about consumers in that area do you need to gather and understand to determine if people there will actually consume your coffee?
How do the concepts of “budget and…
(c) Assume an infinite horizon, continuous time and certainty.
Furthermore, assume an additively separable utility function in
consumption C and pollution stock S so that, U(C,S) = u(C) +
v(S), where uc > 0; Ucc 0. Note that the first
derivative, and the second subscript denotes the second
derivative. The evolution of the pollution stock S over time is a
function of consumption, decay rate of the stock of pollution &
and abatement through the function, g(S) with gs > 0 and 9ss <
0. Time subscripts are ignored for ease of notation.
Show that in the case of a stock pollutant, the marginal utility of
consumption should equal the present value of disutility
associated with the pollution stock. Interpret the condition.
Chapter 19 Solutions
Principles Of Economics 2e
Ch. 19 - Country A has export sales of 20 billion,...Ch. 19 - Which of the following are included in GDP, and...Ch. 19 - Using data from Table 19.5 how much of the nominal...Ch. 19 - Without looking at Table 19.7, return to Figure...Ch. 19 - According to Table 19.7, how often have recessions...Ch. 19 - According to Table 19.7, how long has the average...Ch. 19 - According to Table 19.7, how long has the average...Ch. 19 - Is it possible for GDP to rise while at the same...Ch. 19 - The Central African Republic has a GDP of...Ch. 19 - Explain briefly whether each of the following...
Ch. 19 - What are the main components of measuring GDP with...Ch. 19 - What are the main components of measuring GDP with...Ch. 19 - Would you usually expect GDP as measured by what...Ch. 19 - Why must you avoid double counting when measuring...Ch. 19 - What is the difference between a series of...Ch. 19 - How do you convert a series of nominal economic...Ch. 19 - What are typical GDP patterns for a high-income...Ch. 19 - What are the two main difficulties that arise in...Ch. 19 - List some of the reasons why economists should not...Ch. 19 - U.S. macroeconomic data are among the best in the...Ch. 19 - What does GDP not tell us about the economy?Ch. 19 - Should people typically pay more attention to...Ch. 19 - Why do you suppose that U.S. GDP is so much higher...Ch. 19 - Why do you think that GDP does not grow at a...Ch. 19 - Cross country comparisons of GDP per capita...Ch. 19 - Why might per capita GDP be only an imperfect...Ch. 19 - How might you measure a green GDP?Ch. 19 - Last year, a small nation with abundant forests...Ch. 19 - The prime interest rate is the rate that banks...Ch. 19 - A mortgage 105m is a loan that a person makes to...Ch. 19 - Ethiopia has a GDP of 8 billion (measured in U.S....Ch. 19 - In 1980, Denmark had a GDP of 70 billion (measured...Ch. 19 - The Czech Republic has 3 GDP of 1,800 billion...
Additional Business Textbook Solutions
Find more solutions based on key concepts
Comparison of projects using Net Present Value. Reasons for the conflicts in ranking using Net Present Value an...
Gitman: Principl Manageri Finance_15 (15th Edition) (What's New in Finance)
(Future and present value using a calculator) In 2016 Bill Gates was worth about $82 billion. Let’s see what Bi...
Foundations Of Finance
Quick ratio and current ratio (Learning Objective 7) 1520 min. Consider the following data COMPANY A B C D Cash...
Financial Accounting, Student Value Edition (5th Edition)
How is inventory tracked under a perpetual inventory system?
Intermediate Accounting (2nd Edition)
1.10 Brown’s, a local bakery, is worried about increased costs—particularly energy. Last year’s records can pro...
Operations Management
E6-14 Using accounting vocabulary
Learning Objective 1, 2
Match the accounting terms with the corresponding d...
Horngren's Accounting (12th Edition)
Knowledge Booster
Similar questions
- Q3/for a closed loop system whose block diagram is shown in the figure determine the values of K and t such that the maximum overshoot to the unit step input is 25% and time to peak is 2 sec K 1+TS $2arrow_forward2. Question The 'Democratic Family' consists of three members {mother m, father f, daughter d}, that have different preferences with respect to how much money X € [0,8] they think should be invested in the new family car. These preferences can be represented by the following utility functions: - Mother m: um(X) = 2X - X² Father f: uf(X) = 10X - X² - Daughter d: ud(X) = 4X - X² Calculate for each family member (f, m, d) the preferred amount of money to invest in the new car denoted by X; for i = {m, f,d}. Assume that (Xf, Xm, Xd) are the three alternatives on which the family must decide. Show that each family member has rational preferences over this domain. Preferences on the family level are determined by pairwise majority voting (all family members vote on two alternatives). Derive the family preference and check whether it is rational. Assume that the final family decision is made by conducting sequential pair- wise majority voting, where the loosing alternative is eliminated. Does…arrow_forward3. Question You invented a new lateral-flow test for asymptomatic Covid-19 detection, where saliva is entered into a test-tube and then the result is shown directly on the device. However, to save on costly chemicals you designed the tests such that it always reports a negative test result. Assume that the incidence rate is 5 per 1000 and that your test is used for detection of asymptomatic cases (without symptoms). (a) Calculate the probability that 100 randomly determined volunteers receive a correct test result by using the AND-rule and the OR-rule. Can your test be qualified as a diagnostic test? (b) The health authorities are investigating the performance of your test. Government guidelines require a specificity (conditional probability to re- ceive a negative test result given that the test-taker is not infected with COVID19) of at least 97% and a sensitivity (conditional probability to receive a positive test result given that the test-taker is infected with COVID-19) of at…arrow_forward
- 3. Question You invented a new lateral-flow test for asymptomatic Covid-19 detection, where saliva is entered into a test-tube and then the result is shown directly on the device. However, to save on costly chemicals you designed the tests such that it always reports a negative test result. Assume that the incidence rate is 5 per 1000 and that your test is used for detection of asymptomatic cases (without symptoms). (a) Calculate the probability that 100 randomly determined volunteers receive a correct test result by using the AND-rule and the OR-rule. Can your test be qualified as a diagnostic test? (b) The health authorities are investigating the performance of your test. Government guidelines require a specificity (conditional probability to re- ceive a negative test result given that the test-taker is not infected with COVID19) of at least 97% and a sensitivity (conditional probability to receive a positive test result given that the test-taker is infected with COVID-19) of at…arrow_forwardI need expert handwritten solutionsarrow_forwardmachine A operated manually cost 2000naira has a life of 2 years, while an automatic machine B cost 5000naira but has a life of 4 years,operating cost for machine A is 4000naira per year while of machine B is 3000naira only, which should be purchased?consider 10% interest I need expert handwritten solutionsarrow_forward
arrow_back_ios
SEE MORE QUESTIONS
arrow_forward_ios
Recommended textbooks for you


 Macroeconomics: Private and Public Choice (MindTa...EconomicsISBN:9781305506756Author:James D. Gwartney, Richard L. Stroup, Russell S. Sobel, David A. MacphersonPublisher:Cengage Learning
 Economics: Private and Public Choice (MindTap Cou...EconomicsISBN:9781305506725Author:James D. Gwartney, Richard L. Stroup, Russell S. Sobel, David A. MacphersonPublisher:Cengage Learning


Macroeconomics: Private and Public Choice (MindTa...
Economics
ISBN:9781305506756
Author:James D. Gwartney, Richard L. Stroup, Russell S. Sobel, David A. Macpherson
Publisher:Cengage Learning

Economics: Private and Public Choice (MindTap Cou...
Economics
ISBN:9781305506725
Author:James D. Gwartney, Richard L. Stroup, Russell S. Sobel, David A. Macpherson
Publisher:Cengage Learning
