1 Introduction, Measurement, Estimating 2 Describing Motion: Kinematics In One Dimension 3 Kinematics In Two Or Three Dimensions; Vectors 4 Dynamics: Newton's Laws Of Motion 5 Using Newton's Laws: Friction, Circular Motion, Drag Forces 6 Gravitation And Newton's Synthesis 7 Work And Energy 8 Conservation Of Energy 9 Linear Momentum 10 Rotationalmotion 11 Angular Momentum; General Rotation 12 Static Equilibrium; Elasticity And Fracture 13 Fluids 14 Oscillations 15 Wave Motion 16 Sound 17 Temperature, Thermal Expansion And The Ideal Gas Law 18 Kinetic Theory Of Gases 19 Heat And The First Law Of Thermodynamics 20 Second Law Of Thermodynamics 21 Electric Charge And Electric Field 22 Gauss's Law 23 Electric Potential 24 Capacitance, Dielectrics, Electric Energy Storage 25 Electric Currents And Resistance 26 Dc Circuits 27 Magnetism 28 Sources Of Magnetic Field 29 Electromagnetic Induction And Faraday's Law 30 Inductance, Electromagnetic Oscillations, And Ac Circuits 31 Maxwell's Equation And Electromagnetic Waves 32 Light: Reflection And Refraction 33 Lenses And Optical Instruments 34 The Wave Nature Of Light: Interference 35 Diffraction And Polarization 36 Special Theory Of Relativity 37 Early Quantum Theory And Models Of The Atom 38 Quantum Mechanics 39 Quantum Mechanics Of Atoms 40 Molecules And Solids 41 Nuclear Physics And Radioactivity 42 Nuclear Energy; Effects And Uses Of Radiation 43 Elementary Particles 44 Astrophysics And Cosmology expand_more
19.1 Heat As Energy Transfer 19.2 Internal Energy 19.3 Specific Heat 19.4 Calorimetry—solving Problems 19.5 Latent Heat 19.6 The First Law Of Thermodynamics 19.7 The First Law Of Thermodynamics Applied; Calculating The Work 19.8 Molar Specific Heats For Gases, And The Equipartition Of Energ 19.9 Adiabatic Expansion Of A Gas 19.10 Heat Transfer: Conduction, Convection, Radiation Chapter Questions expand_more
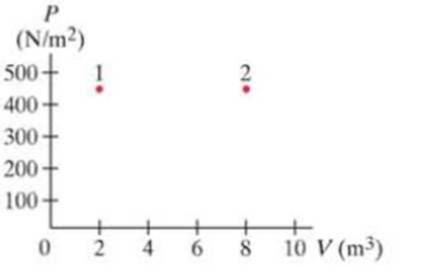
Problem 1Q: What happens to the work done on a jar of orange juice when it is vigorously shaken? Problem 2Q Problem 3Q Problem 4Q Problem 5Q Problem 6Q: Why does water in a canteen stay cooler if the cloth jacket surrounding the canteen is kept moist? Problem 7Q: Explain why burns caused by steam at 100C on the skin are often more severe than burns caused by... Problem 8Q Problem 9Q: Will potatoes cook faster if the water is boiling more vigorously? Problem 10Q Problem 11Q Problem 12Q: Use the conservation of energy to explain why the temperature of a well-insulated gas increases when... Problem 13Q: In an isothermal process, 3700 J of work is done by an ideal gas. Is this enough information to tell... Problem 14Q: Explorers on failed Arctic expeditions have survived by covering themselves with snow. Why would... Problem 15Q: Why is wet sand at the beach cooler to walk on than dry sand? Problem 16Q: When hot-air furnaces are used to heat a house, why is it important that there be a vent for air to... Problem 17Q: Is it possible for the temperature of a system to remain constant even though heat flows into or out... Problem 18Q: Discuss how the first law of thermodynamics can apply to metabolism in humans. In particular, note... Problem 19Q: Explain in words why CP is greater than CV. Problem 20Q Problem 21Q: An ideal monatomic gas is allowed to expand slowly to twice its volume (1) isothermally; (2)... Problem 22Q: Ceiling fans are sometimes reversible, so that they drive the air down in one season and pull it up... Problem 23Q: Goose down sleeping bags and parkas are often specified as so many inches or centimeters of loft,... Problem 24Q: Microprocessor chips nowadays have a heat sink glued on top that looks like a series of fins. Why is... Problem 25Q: Sea breezes are often encountered on sunny days at the shore of a large body of water. Explain,... Problem 26Q: The Earth cools off at night much more quickly when the weather is clear than when cloudy. Why? Problem 27Q: Explain why air-temperature readings are always taken with the thermometer in the shade. Problem 28Q: A premature baby in an incubator can be dangerously cooled even when the air temperature in the... Problem 29Q Problem 31Q: A 22C day is warm, while a swimming pool at 22C feelscool. Why? Problem 32Q Problem 33Q Problem 34Q Problem 35Q Problem 36Q: An emergency blanket is a thin shiny (metal-coated) plasticfoil. Explain how it can help to keep an... Problem 37Q: Explain why cities situated by the ocean tend to have lessextreme temperatures than inland cities at... Problem 1P: (I) To what temperature will 8700 J of heat raise 3.0kg of water that is initially at 10.0C? Problem 2P Problem 3P Problem 4P: (II) A British thermal unit (Btu) is a unit of heat in the British system of units. One Btu is... Problem 5P Problem 6P Problem 7P: (I) An automobile cooling system holds 18 L of water. How much heat does it absorb if its... Problem 8P Problem 9P: (II) (a) How much energy is required to bring a 1.0-L pot of water at 20C to 100C? (b) For how long... Problem 10P Problem 11P Problem 12P: (II) A hot iron horseshoe (mass = 0.40kg), just forged (Fig. 19-28), is dropped into 1.05 L of water... Problem 13P: (II) A 31.5-g glass thermometer reads 23.6C before it is placed in 135 mL of water. When the water... Problem 14P Problem 15P: (II) When a 290-g piece of iron at 180C is placed in a 95-g aluminum calorimeter cup containing 250... Problem 16P: (II) The heat capacity. C, of an object is defined as the amount of heat needed to raise its... Problem 17P: (II) The 1.20-kg head of a hammer has a speed of 7.5 m/s just before it strikes a nail (Fig. 1929)... Problem 18P: (I) How much heat is needed to melt 26.50kg of silver that is initially at 25C? Problem 19P: (I) During exercise, a person may give off 180 kcal of heat in 25 min by evaporation of water from... Problem 20P: (II) A 35g ice cube at its melting point is dropped into an insulated container of liquid nitrogen.... Problem 21P: (II) High-altitude mountain climbers do not eat snow, but always melt it first with a stove. To see... Problem 22P: (II) An iron boiler of mass 180 kg contains 730kg of water at 18C. A heater supplies energy at the... Problem 23P: (II) In a hot days race, a bicyclist consumes 8.0 L of water over the span of 3.5 hours. Making the... Problem 24P: (II) The specific heat of mercury is 138 J/kg C. Determine the latent heat of fusion of mercury... Problem 25P Problem 26P: (II) A 58-kg ice-skater moving at 7.5 m/s glides to a stop. Assuming the ice is at 0C and that 50%... Problem 27P: (I) Sketch a PV diagram of the following process: 2.0 L of ideal gas at atmospheric pressure are... Problem 28P: (I) A gas is enclosed in a cylinder fitted with a light frictionless piston and maintained at... Problem 29P: (II) The pressure in an ideal gas is cut in half slowly, while being kept in a container with rigid... Problem 30P: (II) A 1.0-L volume of air initially at 3.5 atm of (absolute) pressure is allowed to expand... Problem 31P: (II) Consider the following two-step process. Heat is allowed to flow out of an ideal gas at... Problem 32P: (II) The PV diagram in Fig. 1931 shows two possible states of a system containing 1.55 moles of a... Problem 33P: (II) Suppose 2.60 mol of an ideal gas of volume V1 = 3.50 m3 at T1 = 290 K is allowed to expand... Problem 34P: (II) In an engine, an almost ideal gas is compressed adiabatically to half its volume. In doing so,... Problem 35P: (II) One and one-half moles of an ideal monatomic gas expand adiabatically, performing 7500J of work... Problem 36P: (II) Determine (a) the work done and (b) the change in internal energy of 1.00 kg of water when it... Problem 37P: (II) How much work is done by a pump to slowly compress, isothermally, 3.501 L, of nitrogen at 0C... Problem 38P: (II) When a gas is taken from a to c along the curved path in Fig. 19-32, the work done by the gas... Problem 39P: (III) In the process of taking a gas from state a to state c along the curved path shown in Fig.... Problem 40P: (III) Suppose a gas is taken clockwise around the rectangular cycle shown in Fig. 19-32, starting at... Problem 41P: (III) Determine the work done by 1.00 mol of a van der Waals gas (Section 185) when it expands from... Problem 42P: (I) What is the internal energy of 4.50 mol of an ideal diatomic gas at 645 K, assuming all degrees... Problem 43P Problem 44P Problem 45P Problem 46P: What gas is it? (II) Show that the work done by n moles of an ideal gas when it expands... Problem 47P: (II) An audience of 1800 fills a concert hall of volume 22,000 m3. If there were no ventilation, by... Problem 48P Problem 49P Problem 50P: (III) A 1.00-mol sample of an ideal diatomic gas at a pressure of 1.00 atm and temperature of 420 ... Problem 51P: (I) A 1.00-mol sample of an ideal diatomic gas, originally at 1.00 atm and 20C, expands... Problem 52P: (II) Show, using Eqs. 196 and 1915, that the work done by a gas that slowly expands adiabatically... Problem 53P: (III) A 3.65-mol sample of an ideal diatomic gas expands adiabatically from a volume of 0.1210 m3 to... Problem 54P: (II) An ideal monatomic gas, consisting of 2.8 mol of volume 0.086 m3, expands adiabatically. The... Problem 55P: (III) A 1.00-mol sample of an ideal monatomic gas, originally at a pressure of 1.00 atm, undergoes a... Problem 56P: (III) Consider a parcel of air moving to a different altitude y in the Earths atmosphere (Fig.... Problem 57P Problem 58P: (I) One end of a 45-cm-long copper rod with a diameter of 2.0 cm is kept at 460C, and the other is... Problem 59P: (II) How long does it take the Sun to melt a block of ice at 0C with a flat horizontal area 1.0 m2... Problem 60P: (II) Heat conduction to skin. Suppose 150 W of heat flows by conduction from the blood capillaries... Problem 61P: (II) A ceramic teapot ( = 0.70) and a shiny one ( = 0.10) each hold 0.55 L of tea at 95C. (a)... Problem 62P: (II) A copper rod and an aluminum rod of the same length and cross-sectional area are attached end... Problem 63P Problem 64P Problem 65P: (III) A house thermostat is normally set to 22C, but at night it is turned down to 12C for 9.0 h.... Problem 66P: (III) Approximately how long should it take 9.5 kg of ice at 0C to melt when it is placed in a... Problem 67P: (III) A cylindrical pipe has inner radius R1 and outer radius R2. The interior of the pipe carries... Problem 68P: (III) Suppose the insulating qualities of the wall of a house come mainly from a 4.0-in, layer of... Problem 69GP Problem 70GP: (a) Find the total power radiated into space by the Sun, assuming it to be a perfect emitter at T =... Problem 71GP Problem 72GP: A mountain climber wears a goose-down jacket 3.5 cm thick with total surface area 0.95 m2. The... Problem 73GP Problem 74GP: Estimate the rate at which heat can he conducted from the interior of the body to the surface.... Problem 75GP: A marathon runner has an average metabolism rate of about 950 kcal/h during a race. If the runner... Problem 76GP: A house has well-insulated walls 19.5 cm thick (assume conductivity of air) and area 410 m2, a roof... Problem 77GP: In a typical game of squash (Fig. 19-36), two people hit a soft rubber ball at a wall until they are... Problem 78GP: A bicycle pump is a cylinder 22 cm long and 3.0 cm in diameter. The pump contains air at 20.0C and... Problem 79GP Problem 80GP: The temperature within the Earths crust increases about 1.0 C for each 30 m of depth. The thermal... Problem 81GP: An ice sheet forms on a lake. The air above the sheet is at 18C, whereas the water is at 0C. Assume... Problem 82GP: An iron meteorite melts when it enters the Earths atmosphere. If its initial temperature was 105C... Problem 83GP: A scuba diver releases a 3.60-cm-diameter (spherical) bubble of air from a depth of 14.0 m. Assume... Problem 84GP: A reciprocating compressor is a device that compresses air by a back-and-forth straight-line motion,... Problem 85GP: The temperature of the glass surface of a 75-W lightbulb is 75C when the room temperature is 18C.... Problem 86GP: Suppose 3.0 mol of neon (an ideal monatomic gas) at STP are compressed slowly and isothermally to... Problem 87GP: At very low temperatures, the molar specific heat of many substances varies as the cube of the... Problem 88GP: A diesel engine accomplishes ignition without a spark plug by an adiabatic compression of air to a... Problem 89GP: When 6.30 105 J of heat is added to a gas enclosed in a cylinder fitted with a light frictionless... Problem 90GP: In a cold environment, a person can lose heat by conduction and radiation at a rate of about 200 W.... Problem 91GP format_list_bulleted


 Physics for Scientists and Engineers: Foundations...PhysicsISBN:9781133939146Author:Katz, Debora M.Publisher:Cengage Learning
 Principles of Physics: A Calculus-Based TextPhysicsISBN:9781133104261Author:Raymond A. Serway, John W. JewettPublisher:Cengage Learning
 College PhysicsPhysicsISBN:9781285737027Author:Raymond A. Serway, Chris VuillePublisher:Cengage Learning
 Physics for Scientists and Engineers, Technology ...PhysicsISBN:9781305116399Author:Raymond A. Serway, John W. JewettPublisher:Cengage Learning
 College PhysicsPhysicsISBN:9781305952300Author:Raymond A. Serway, Chris VuillePublisher:Cengage Learning


