Concept explainers
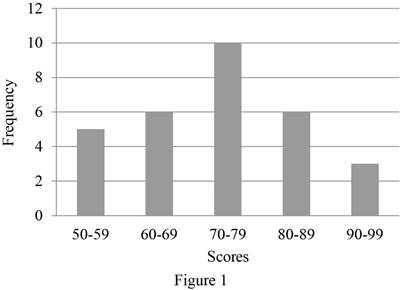
The scores of a test for an engineering class of 30 students are shown here. Organize the data in a manner similar to Table 19.1 and use Excel to create a histogram.
Scores: 57, 94, 81, 77, 66, 97, 62, 86, 75, 87, 91, 78, 61, 82, 74, 72, 70, 88, 66, 75, 55, 66, 58, 73, 79, 51, 63, 77, 52, 84
Create a histogram for the test scores of an engineering class students using Excel.
Explanation of Solution
Given data:
Number of students,
Students test scores are 57, 94, 81, 77, 66, 97, 62, 86, 75, 87, 91, 78, 61, 82, 74, 72, 70, 88, 66, 75, 55, 66, 58, 73, 79, 51, 63, 77, 52, 84.
Calculation:
The given test scores are organized in a grouped frequency distribution manner which is shown in Table 1. In the distribution, the frequency represents the number of test scores in a given range.
Table 1
| Scores | Range | Frequency |
| 57, 55, 58, 51, 52 | 50-59 | 5 |
| 66, 62, 61, 66, 66, 63 | 60-69 | 6 |
| 77, 75, 78, 74, 72, 70, 75, 73, 79, 77 | 70-79 | 10 |
| 81, 86, 87, 82, 88, 84 | 80-89 | 6 |
| 94, 97, 91 | 90-99 | 3 |
Draw the histogram for the students test scores for the respective frequency

Therefore, the histogram for the test scores of engineering class students is shown in Figure 1.
Conclusion:
Thus, the histogram for the test scores of an engineering class students has been created using Excel.
Want to see more full solutions like this?
Chapter 19 Solutions
EBK ENGINEERING FUNDAMENTALS: AN INTROD
- REINFORCED CONCRETE DESIGNFLEXURAL ANALYSIS OF BEAMS (CRACKED SECTION)Solution must be completeUse ballpen/inkpenAnswer in two decimal placesBox your final answerarrow_forwardA vertical parabolic curve has a back tangent of -5% and a forward tangent of +3% intersecting at station 1 + 240 at an elevation of 100m. If the stationing of PC is at 1 + 120, Evaluate the elevation at the third quarter point.arrow_forwardREINFORCED CONCRETE DESIGNFLEXURAL ANALYSIS OF BEAMS (CRACKED SECTION)Solution must be completeUse ballpen/inkpenAnswer in two decimal placesBox your final answerarrow_forward
- What is the volume of the earth's mantle in cubic kilometers? (tute problem 4d) Note: enter the number without units. For large (or small) numbers, use E notation, e.g. three million is equivalent to 3*10^6 which is 3E6 in E notation.arrow_forwardH.W: From an in-out survey conducted for a parking area consisting of 40 bays, the initial count was found to be 20 vehicles. Table gives the result of the survey. The number of vehicles coming in and out of the parking lot for a time interval of 5 minutes is as shown in the table below. Find the accumulation, total parking load, average occupancy and efficiency of the parking lot. Table: In-out survey data Time (minutes) In Out 5 3 2 10 6 2 15 3 1 20 6 7 25 6 4 30 8 6arrow_forwardcan you show me step for step? Autocad has me irritated.arrow_forward
- mummins) Is there any risk from a contaminant if 150 out of 3800 people exposed to the groundwater contaminant develop cancer and 125 out of 5000 people not exposed to the contamination also develop cancer? Why or why not? Use at least two methods to support your answer.arrow_forwardA spare buoy is a buoyant rod weighted to float and protrude vertically, as shown in thefigure below. Suppose that the buoy is made of maple wood ( specific gravity s = 0.6), has arectangular cross section ( 2.54cm by 2.54cm ), a length of 3.7 m , and is floating in seawater( specific gravity s =1.025 ). What weight of steel should be added to the bottom end of thebuoy so that h=0.45 cm? ( The specific gravity of steel s = 7.85 )arrow_forward8-42. Determine the displacement at point D. Use the principle of virtual work. El is constant. 60 kN 2m- 2 m B 30 kN/m 3 marrow_forward
- Two monitoring wells are spaced 500 m apart along the direction of groundwater flow in a confined aquifer 30.0 m thick. The difference in water level in the wells is 2.5 m. The hydraulic conductivity is 40 m/d. a) Sketch the aquifer and wells and label distances and direction of groundwater flow. b) If the real velocity of the groundwater is 0.6 m/d, what is the porosity? c) If it takes 10 years for a petroleum hydrocarbon plume to appear in the second well, what was the retardation factor?arrow_forward9. 0000) Water in a lake contains 10.5 ppb of vinyl chloride, which has a potency factor of 2.3 (mg/kg-d) 1 a. What is the incremental cancer risk for children (average weight of 15 kg) who may ingest 0.05 L of water per day while playing in the water every summer (for approximately 60 days) for 10 years? b. Is this risk acceptable? Why or why not?arrow_forward8-37. Determine the displacement of point C. Use the method of virtual work. El is constant. -12 ft- 3 k/ft -12 ft- Barrow_forward
 Engineering Fundamentals: An Introduction to Engi...Civil EngineeringISBN:9781305084766Author:Saeed MoaveniPublisher:Cengage Learning
