Organic Chemistry-Package(Custom)
4th Edition
ISBN: 9781259141089
Author: SMITH
Publisher: MCG
bartleby

Concept explainers

bartleby

Videos

Textbook Question
Book Icon
Chapter 19, Problem 19.56P

Identify each compound from its spectral data.

a . Molecular formula : C 3 H 5 ClO 2 IR : 3500 2500 cm 1 , 1714 cm 1 1 H NMR data : 2 .87 ( triplet, 2H ) , 3 .76 ( triplet, 2H )  and 11 .8 ( singlet, 1H )  ppm b . Molecular formula: C 8 H 8 O 3 IR : 3500 2500 cm 1 , 1688 cm 1 1 H NMR data : 3 .8 ( singlet, 3H ) , 7 .0 ( doublet, 2H ) , 7 .9 ( doublet, 2H )  and 12 .7 ( singlet, 1H )  ppm c . Molecular formula: C 8 H 8 O 3 IR : 3500 2500 cm 1 , 1710 cm 1 1 H NMR data : 4 .7 ( singlet, 2H ) , 6 .9-7 .3 ( multiplet, 5H )  and 11 .3 ( singlet, 1H )  ppm

Expert Solution
Check Mark
Interpretation Introduction

(a)

Interpretation: The given compound is to be identified from its spectral data.

Concept introduction: IR spectroscopy is used to identify the functional group present in a compound. Each and every bond vibrates at a characteristic frequency. Proton NMR spectroscopy identifies the number of hydrogen atoms present in a molecule and the nature of the functional group. The value of chemical peaks depends upon the chemical environment around the hydrogen atom.

Answer to Problem 19.56P

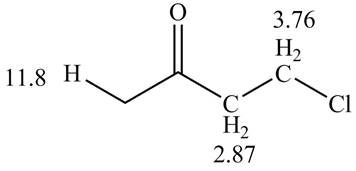
The given compound from its spectrum data of IR, and 1HNMR is,
Organic Chemistry-Package(Custom), Chapter 19, Problem 19.56P , additional homework tip  1

Figure 1

Explanation of Solution

The spectral data for the given compound is as follows:

Molecular formula:C3H5ClO2IR:35002500 cm1, 1714 cm11H NMR data:2.87(triplet, 2H), 3.76(triplet, 2H) and 11.8(singlet, 1H) ppm Information from IR spectrum data:

IR absorptions at 36002500 cm-1 suggests the presence of O-H bond of carboxylic acid and absorption at 1714 cm1 suggests the presence of C=O bond of carboxylic acid.

Information from 1HNMR spectrum data:

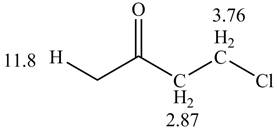
The observed chemical shift value at 3.76(singlet,2H)ppm, suggests the presence of CH2 group, bonded to the carbon that has 2H's. The slightly downfield absorption shift indicates that CH2 group is also bonded to some electron withdrawing group like chlorine.

The observed chemical shift value at 2.87(triplet,2H)ppm, suggests the presence of CH2 group, bonded to the adjacent carbon atom that has 2H's respectively.

The observed chemical shift values at 11.8(singlet,1H)ppm, suggests the presence of carboxylic group.

Thus, the structure of a given compound from its spectrum data of IR, and 1HNMR is,
Organic Chemistry-Package(Custom), Chapter 19, Problem 19.56P , additional homework tip  2

Figure 1

Conclusion

The given compound from its spectrum data of IR, and 1HNMR is shown in Figure 1.
Expert Solution
Check Mark
Interpretation Introduction

(b)

Interpretation: The given compound is to be identified from its spectral data.

Concept introduction: IR spectroscopy is used to identify the functional group present in a compound. Each and every bond vibrates at a characteristic frequency. Proton NMR spectroscopy identifies the number of hydrogen atoms present in a molecule and the nature of the functional group. The value of chemical peaks depends upon the chemical environment around the hydrogen atom.

Answer to Problem 19.56P

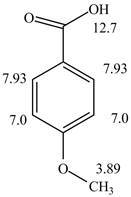
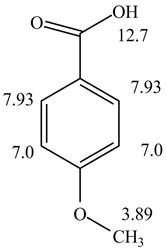
The structure of a given compound from its spectrum data of IR, and 1HNMR is,
Organic Chemistry-Package(Custom), Chapter 19, Problem 19.56P , additional homework tip  3

Figure 2

Explanation of Solution

The spectral data for the given compound is as follows:

Molecular formula : C8H8O3IR:35002500 cm1, 1688 cm11H NMR data:3.8(singlet, 3H), 7.0(doublet, 2H), 7.9(doublet, 2H) and 12.7(singlet, 1H) ppm Information from IR spectrum data:

IR absorptions at 36002500 cm-1 suggests the presence of O-H bond of carboxylic acid and absorption at 1688 cm1 suggests the presence of C=O bond of carboxylic acid.

Information from 1HNMR spectrum data:

The observed chemical shift values at 7.0(doublet,2H)ppm and 7.93(doublet, 2H) ppm suggest the presence of para substitution on benzene ring. The slightly downfield absorption shift indicates that the adjacent carbon is also bonded to some electron withdrawing group like carboxylic.

The observed chemical shift value at 12.7(singlet,1H)ppm, suggests the presence of carboxylic group.

The observed chemical shift value at 3.8(singlet, 3H)ppm, suggests the presence of methyl group. The slightly downfield absorption shift indicates that CH3 group is also bonded to some electron negative atom like oxygen. Thus, the chemical shift value indicates the presence of ester group.

Thus, the structure of a given compound from its spectrum data of IR, and 1HNMR is,
Organic Chemistry-Package(Custom), Chapter 19, Problem 19.56P , additional homework tip  4

Figure 2

Conclusion

The given compound from its spectrum data of IR, and 1HNMR is shown in Figure 2.
Expert Solution
Check Mark
Interpretation Introduction

(c)

Interpretation: The given compound is to be identified from its spectral data.

Concept introduction: IR spectroscopy is used to identify the functional group present in a compound. Each and every bond vibrates at a characteristic frequency. Proton NMR spectroscopy identifies the number of hydrogen atoms present in a molecule and the nature of the functional group. The value of chemical peaks depends upon the chemical environment around the hydrogen atom

Answer to Problem 19.56P

The given compound from its spectrum data of IR, and 1HNMR is as shown below.

Organic Chemistry-Package(Custom), Chapter 19, Problem 19.56P , additional homework tip  5

Figure 3

Explanation of Solution

The spectral data for the given compound is as follows:

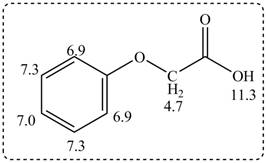
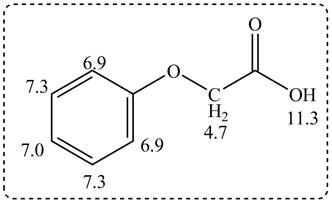
Molecular formula : C8H8O3IR:35002500 cm1, 1710 cm11H NMR data:4.7(singlet, 2H), 6.9-7.3(multiplet, 5H) and 11.3(singlet, 1H) ppm Information from IR spectrum data:

IR absorptions at 36002500 cm-1 suggests the presence of O-H bond of carboxylic acid and absorption at 1710 cm1 suggests the presence of C=O bond of carboxylic acid.

Information from 1HNMR spectrum data:

The observed chemical shift values at 6.97.3(multiplet,5H)ppm suggest the presence of monosubstitution on benzene ring.

The observed chemical shift value at 11.3(singlet,1H)ppm, suggests the presence of carboxylic group.

The observed chemical shift value at 4.7(singlet, 2H)ppm, suggests the presence of methylene group. The slightly downfield absorption shift indicates that CH2 group is also bonded to some electronegative atom like oxygen.

Thus, the structure of a given compound from its spectrum data of IR, and 1HNMR is,

Organic Chemistry-Package(Custom), Chapter 19, Problem 19.56P , additional homework tip  6

Figure 3

Conclusion

The given compound from its spectrum data of IR, and 1HNMR is shown in Figure 3.

Want to see more full solutions like this?

Subscribe now to access step-by-step solutions to millions of textbook problems written by subject matter experts!
Students have asked these similar questions
At 0oC and 1 atm, the viscosity of hydrogen (gas) is 8.55x10⁻⁵ P. Calculate the viscosity of a gas, if possible, consisting of deuterium. Assume that the molecular sizes are equal.
Indicate the correct option for the velocity distribution function of gas molecules:a) its velocity cannot be measured in any other way due to the small size of the gas moleculesb) it is only used to describe the velocity of particles if their density is very high.c) it describes the probability that a gas particle has a velocity in a given interval of velocitiesd) it describes other magnitudes, such as pressure, energy, etc., but not the velocity of the molecules

Chapter 19 Solutions

Organic Chemistry-Package(Custom)

Ch. 19 - Prob. 19.11PCh. 19 - Draw the products of each acid-base reaction.Ch. 19 - Problem 19.14 Given the values in Appendix A,...Ch. 19 - Problem 19.15 Rank the labeled protons in...Ch. 19 - Problem 19.16 Match each of the following values ...Ch. 19 - Rank the compounds in each group in order of...Ch. 19 - Rank the compounds in each group in order of...Ch. 19 - Prob. 19.18PCh. 19 - Which of the following pairs of compounds can be...Ch. 19 - Problem 19.21 Two other commonly used sulfonic...Ch. 19 - Problem 19.22 Draw both enantiomers of each amino...Ch. 19 - Problem 19.23 Explain why amino acids, unlike most...Ch. 19 - Problem 19.24 Draw the positively charged,...Ch. 19 - Prob. 19.24PCh. 19 - Problem 19.26 Explain why the of the group of...Ch. 19 - Answer each question for A and B depicted in the...Ch. 19 - Prob. 19.27PCh. 19 - Give the IUPAC name for each compound. a....Ch. 19 - Prob. 19.29PCh. 19 - Draw the structures and give the IUPAC names for...Ch. 19 - Prob. 19.31PCh. 19 - Rank the compounds in each group in order of...Ch. 19 - 19.33 Draw the organic products formed in each...Ch. 19 - 19.34 Identify the lettered compounds in each...Ch. 19 - 19.35 Using the table in Appendix A, determine...Ch. 19 - Draw the products of each acid-base reaction, and...Ch. 19 - Which compound in each pair has the lower pKa?...Ch. 19 - 19.38 Rank the compounds in each group in order of...Ch. 19 - Rank the compounds in each group in order of...Ch. 19 - 19.40 Match the values to the appropriate...Ch. 19 - Prob. 19.41PCh. 19 - 19.42 Which carboxylic acid has the lower ,...Ch. 19 - Prob. 19.43PCh. 19 - 19.44 Explain the following statement. Although...Ch. 19 - Prob. 19.45PCh. 19 - 19.46 Explain why the of compound A is lower than...Ch. 19 - 19.47 Rank the following compounds in order of...Ch. 19 - Explain the following result. Acetic acid...Ch. 19 - 19.50 Draw all resonance structures of the...Ch. 19 - As we will see in Chapter 23, CH bonds are...Ch. 19 - Prob. 19.51PCh. 19 - The pKa of acetamide (CH3CONH2) is 16. Draw the...Ch. 19 - 19.54 Write out the steps needed to separate...Ch. 19 - Prob. 19.54PCh. 19 - Can octane and octan -1- ol be separated using an...Ch. 19 - 19.57 Identify each compound from its spectral...Ch. 19 - 19.58 Use the NMR and IR spectra given below to...Ch. 19 - 19.59 An unknown compound (molecular formula )...Ch. 19 - 19.60 Propose a structure for (molecular formula...Ch. 19 - Prob. 19.60PCh. 19 - 19.61 Match the data to the appropriate...Ch. 19 - Prob. 19.62PCh. 19 - Prob. 19.63PCh. 19 - Prob. 19.64PCh. 19 - 19.65 For each amino acid ,draw its neutral,...Ch. 19 - Calculate the isoelectric point for each amino...Ch. 19 - 19.67 Lysine and tryptophan are two amino acids...Ch. 19 - Prob. 19.68PCh. 19 - Prob. 19.69PCh. 19 - Prob. 19.70PCh. 19 - Prob. 19.71PCh. 19 - 19.71 Hydroxy butanedioic acid occurs naturally in...Ch. 19 - 19.72 Although it was initially sold as a rat...
Knowledge Booster
Background pattern image
Chemistry
Learn more about
Need a deep-dive on the concept behind this application? Look no further. Learn more about this topic, chemistry and related others by exploring similar questions and additional content below.
Similar questions
SEE MORE QUESTIONS
Recommended textbooks for you
  • Text book image
    Organic Chemistry
    Chemistry
    ISBN:9781305580350
    Author:William H. Brown, Brent L. Iverson, Eric Anslyn, Christopher S. Foote
    Publisher:Cengage Learning
    Text book image
    Organic Chemistry
    Chemistry
    ISBN:9781305080485
    Author:John E. McMurry
    Publisher:Cengage Learning
Text book image
Organic Chemistry
Chemistry
ISBN:9781305580350
Author:William H. Brown, Brent L. Iverson, Eric Anslyn, Christopher S. Foote
Publisher:Cengage Learning
Text book image
Organic Chemistry
Chemistry
ISBN:9781305080485
Author:John E. McMurry
Publisher:Cengage Learning
NMR Spectroscopy; Author: Professor Dave Explains;https://www.youtube.com/watch?v=SBir5wUS3Bo;License: Standard YouTube License, CC-BY