Organic Chemistry-Package(Custom)
4th Edition
ISBN: 9781259141089
Author: SMITH
Publisher: MCG
expand_more
expand_more
format_list_bulleted
Concept explainers
Videos
Textbook Question
Chapter 19, Problem 19.14P
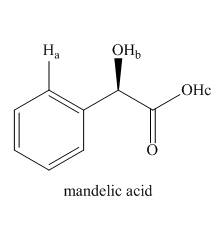
Rank the labeled protons
Expert Solution & Answer
Want to see the full answer?
Check out a sample textbook solution
Students have asked these similar questions
please help me with my homework
help
The temperature on a sample of pure X held at 1.25 atm and -54. °C is increased until the sample boils. The temperature is then held constant and the
pressure is decreased by 0.42 atm. On the phase diagram below draw a path that shows this set of changes.
pressure (atm)
2
0
0
200
400
temperature (K)
X
Chapter 19 Solutions
Organic Chemistry-Package(Custom)
Ch. 19 - Give the IUPAC name for each compound.Ch. 19 - Problem 19.2 Give the structure corresponding to...Ch. 19 - Problem 19.3 Draw the structure corresponding to...Ch. 19 - Prob. 19.4PCh. 19 - Prob. 19.5PCh. 19 - Rank the following compounds in order of...Ch. 19 - Explain how you could use IR spectroscopy to...Ch. 19 - Identify the structure of a compound of molecular...Ch. 19 - Problem 19.9 How many tetrahedral stereogenic...Ch. 19 - What alcohol can be oxidized to each carboxylic...
Ch. 19 - Prob. 19.11PCh. 19 - Draw the products of each acid-base reaction.Ch. 19 - Problem 19.14 Given the values in Appendix A,...Ch. 19 - Problem 19.15 Rank the labeled protons in...Ch. 19 - Problem 19.16 Match each of the following values ...Ch. 19 - Rank the compounds in each group in order of...Ch. 19 - Rank the compounds in each group in order of...Ch. 19 - Prob. 19.18PCh. 19 - Which of the following pairs of compounds can be...Ch. 19 - Problem 19.21 Two other commonly used sulfonic...Ch. 19 - Problem 19.22 Draw both enantiomers of each amino...Ch. 19 - Problem 19.23 Explain why amino acids, unlike most...Ch. 19 - Problem 19.24 Draw the positively charged,...Ch. 19 - Prob. 19.24PCh. 19 - Problem 19.26 Explain why the of the group of...Ch. 19 - Answer each question for A and B depicted in the...Ch. 19 - Prob. 19.27PCh. 19 - Give the IUPAC name for each compound. a....Ch. 19 - Prob. 19.29PCh. 19 - Draw the structures and give the IUPAC names for...Ch. 19 - Prob. 19.31PCh. 19 - Rank the compounds in each group in order of...Ch. 19 - 19.33 Draw the organic products formed in each...Ch. 19 - 19.34 Identify the lettered compounds in each...Ch. 19 - 19.35 Using the table in Appendix A, determine...Ch. 19 - Draw the products of each acid-base reaction, and...Ch. 19 - Which compound in each pair has the lower pKa?...Ch. 19 - 19.38 Rank the compounds in each group in order of...Ch. 19 - Rank the compounds in each group in order of...Ch. 19 - 19.40 Match the values to the appropriate...Ch. 19 - Prob. 19.41PCh. 19 - 19.42 Which carboxylic acid has the lower ,...Ch. 19 - Prob. 19.43PCh. 19 - 19.44 Explain the following statement. Although...Ch. 19 - Prob. 19.45PCh. 19 - 19.46 Explain why the of compound A is lower than...Ch. 19 - 19.47 Rank the following compounds in order of...Ch. 19 - Explain the following result. Acetic acid...Ch. 19 - 19.50 Draw all resonance structures of the...Ch. 19 - As we will see in Chapter 23, CH bonds are...Ch. 19 - Prob. 19.51PCh. 19 - The pKa of acetamide (CH3CONH2) is 16. Draw the...Ch. 19 - 19.54 Write out the steps needed to separate...Ch. 19 - Prob. 19.54PCh. 19 - Can octane and octan -1- ol be separated using an...Ch. 19 - 19.57 Identify each compound from its spectral...Ch. 19 - 19.58 Use the NMR and IR spectra given below to...Ch. 19 - 19.59 An unknown compound (molecular formula )...Ch. 19 - 19.60 Propose a structure for (molecular formula...Ch. 19 - Prob. 19.60PCh. 19 - 19.61 Match the data to the appropriate...Ch. 19 - Prob. 19.62PCh. 19 - Prob. 19.63PCh. 19 - Prob. 19.64PCh. 19 - 19.65 For each amino acid ,draw its neutral,...Ch. 19 - Calculate the isoelectric point for each amino...Ch. 19 - 19.67 Lysine and tryptophan are two amino acids...Ch. 19 - Prob. 19.68PCh. 19 - Prob. 19.69PCh. 19 - Prob. 19.70PCh. 19 - Prob. 19.71PCh. 19 - 19.71 Hydroxy butanedioic acid occurs naturally in...Ch. 19 - 19.72 Although it was initially sold as a rat...
Knowledge Booster


Learn more about
Need a deep-dive on the concept behind this application? Look no further. Learn more about this topic, chemistry and related others by exploring similar questions and additional content below.Similar questions
- QUESTION: Answer Question 5: 'Calculating standard error of regression' STEP 1 by filling in all the empty green boxes *The values are all provided in the photo attached*arrow_forwardpressure (atm) 3 The pressure on a sample of pure X held at 47. °C and 0.88 atm is increased until the sample condenses. The pressure is then held constant and the temperature is decreased by 82. °C. On the phase diagram below draw a path that shows this set of changes. 0 0 200 temperature (K) 400 аarrow_forwarder your payment details | bar xb Home | bartleby x + aleksogi/x/isl.exe/1o u-lgNskr7j8P3jH-1Qs_pBanHhviTCeeBZbufuBYT0Hz7m7D3ZcW81NC1d8Kzb4srFik1OUFhKMUXzhGpw7k1 O States of Matter Sketching a described thermodynamic change on a phase diagram 0/5 The pressure on a sample of pure X held at 47. °C and 0.88 atm is increased until the sample condenses. The pressure is then held constant and the temperature is decreased by 82. °C. On the phase diagram below draw a path that shows this set of changes. pressure (atm) 1 3- 0- 0 200 Explanation Check temperature (K) 400 X Q Search L G 2025 McGraw Hill LLC. All Rights Reserved Terms of Use Privacy Cearrow_forward
- 5.arrow_forward6.arrow_forward0/5 alekscgi/x/sl.exe/1o_u-IgNglkr7j8P3jH-IQs_pBaHhvlTCeeBZbufuBYTi0Hz7m7D3ZcSLEFovsXaorzoFtUs | AbtAURtkqzol 1HRAS286, O States of Matter Sketching a described thermodynamic change on a phase diagram The pressure on a sample of pure X held at 47. °C and 0.88 atm is increased until the sample condenses. The pressure is then held constant and the temperature is decreased by 82. °C. On the phase diagram below draw a path that shows this set of changes. 3 pressure (atm) + 0- 0 5+ 200 temperature (K) 400 Explanation Check X 0+ F3 F4 F5 F6 F7 S 2025 McGraw Hill LLC All Rights Reserved. Terms of Use Privacy Center Accessibility Q Search LUCR + F8 F9 F10 F11 F12 * % & ( 5 6 7 8 9 Y'S Dele Insert PrtSc + Backsarrow_forward
- 5.arrow_forward9arrow_forwardalekscgi/x/lsl.exe/1o_u-IgNslkr7j8P3jH-IQs_pBanHhvlTCeeBZbufu BYTI0Hz7m7D3ZS18w-nDB10538ZsAtmorZoFusYj2Xu9b78gZo- O States of Matter Sketching a described thermodynamic change on a phase diagram 0/5 The pressure on a sample of pure X held at 47. °C and 0.88 atm is increased until the sample condenses. The pressure is then held constant and the temperature is decreased by 82. °C. On the phase diagram below draw a path that shows this set of changes. pressure (atm) 3- 200 temperature (K) Explanation Chick Q Sowncharrow_forward
- 0+ aleksog/x/lsl.exe/1ou-lgNgkr7j8P3H-IQs pBaHhviTCeeBZbufuBYTOHz7m7D3ZStEPTBSB3u9bsp3Da pl19qomOXLhvWbH9wmXW5zm O States of Matter Sketching a described thermodynamic change on a phase diagram 0/5 Gab The temperature on a sample of pure X held at 0.75 atm and -229. °C is increased until the sample sublimes. The temperature is then held constant and the pressure is decreased by 0.50 atm. On the phase diagram below draw a path that shows this set of changes. F3 pressure (atm) 0- 0 200 Explanation temperature (K) Check F4 F5 ☀+ Q Search Chill Will an 9 ENG F6 F7 F8 F9 8 Delete F10 F11 F12 Insert PrtSc 114 d Ararrow_forwardx + LEKS: Using a phase diagram a X n/alekscgi/x/lsl.exe/10_u-IgNsikr7j8P3jH-IQs_pBan HhvlTCeeBZbufu BYTI0Hz7m7D3ZcHYUt80XL-5alyVpw ○ States of Matter Using a phase diagram to find a phase transition temperature or pressure Use the phase diagram of Substance X below to find the melting point of X when the pressure above the solid is 1.1 atm. pressure (atm) 16 08- solid liquid- 0 200 400 gas 600 temperature (K) Note: your answer must be within 25 °C of the exact answer to be graded correct. × 5arrow_forwardS: Using a phase diagram leksogi/x/sl.exe/1ou-IgNs kr 7j8P3jH-IQs_pBan HhvTCeeBZbufuBYTI0Hz7m7D3ZdHYU+80XL-5alyVp O States of Matter Using a phase diagram to find a phase transition temperature or pressure se the phase diagram of Substance X below to find the boiling point of X when the pressure on the liquid is 1.6 atm. pressure (atm) 32- 16- solid liquid 0. gas 100 200 temperature (K) 300 Note: your answer must be within 12.5 °C of the exact answer to be graded correct. 10 Explanation Check § Q Search J 2025 McGraw Hill LLC. All Rights Researrow_forward
arrow_back_ios
SEE MORE QUESTIONS
arrow_forward_ios
Recommended textbooks for you
 Chemistry: The Molecular ScienceChemistryISBN:9781285199047Author:John W. Moore, Conrad L. StanitskiPublisher:Cengage Learning
 Organic ChemistryChemistryISBN:9781305580350Author:William H. Brown, Brent L. Iverson, Eric Anslyn, Christopher S. FootePublisher:Cengage Learning

Chemistry: The Molecular Science
Chemistry
ISBN:9781285199047
Author:John W. Moore, Conrad L. Stanitski
Publisher:Cengage Learning
Organic Chemistry
Chemistry
ISBN:9781305580350
Author:William H. Brown, Brent L. Iverson, Eric Anslyn, Christopher S. Foote
Publisher:Cengage Learning
General Chemistry | Acids & Bases; Author: Ninja Nerd;https://www.youtube.com/watch?v=AOr_5tbgfQ0;License: Standard YouTube License, CC-BY