
Videos
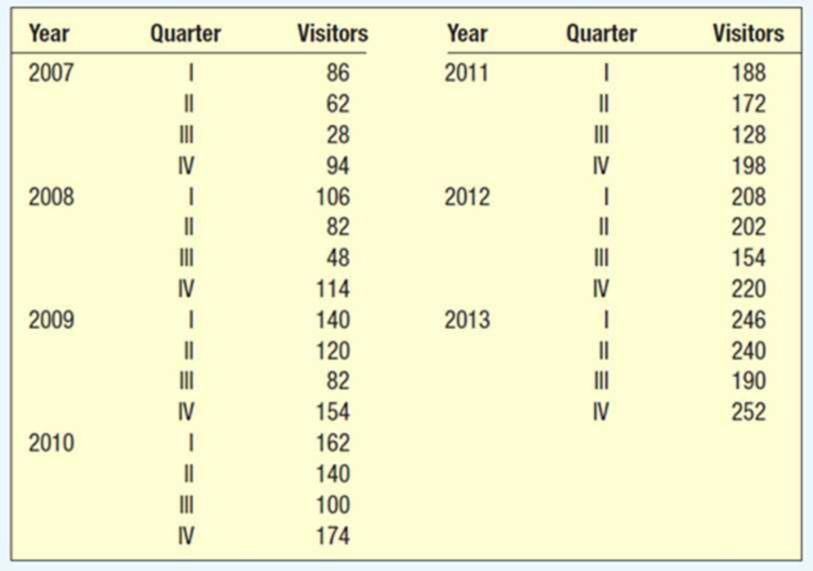
Ray Anderson, owner of Anderson Ski Lodge in upstate New York, is interested in forecasting the number of visitors for the upcoming year. The following data are available, by quarter, from the first quarter of 2007 to the fourth quarter of 2013. Develop a seasonal index for each quarter. How many visitors would you expect for each quarter of 2014, if Ray projects that there will be a 10% increase from the total number of visitors in 2013? Determine the trend equation, project the number of visitors for 2014, and seasonally adjust the forecast. Which forecast would you choose?
Obtain a seasonal index for each of the four quarters.
Find the number of visitors expected for each quarters of 2014 if there is 10% increase in the total number of visitors in 2013.
Obtain the trend equation.
Predict the number of visitors for 2014.
Find the seasonally adjusted forecasts.
Identify the best forecast.
Answer to Problem 33CE
The seasonal indexes for the four quarters are 1.2046, 1.0206, 0.6297, and 01.1451.
The number of visitors for each quarter of 2017 if there is 10% increase in the total number of visitors in 2013 is 255.25 visitors per quarter.
The trend equation is
The number of visitors for 2017 are 242.0171, 248.634, 255.2509, and 261.8678.
The seasonally adjusted forecasts are 291.5338, 253.7559, 160.7315, and 299.8648.
The best forecast is the fourth quarter of 2017.
Explanation of Solution
Four-year moving average:
Centered moving average:
Specific seasonal index:
| Year | Quarter | Visitors |
Four-quarter moving average |
Centered Moving average | Specific seasonal |
| 2007 | 1 | 86 | |||
| 2 | 62 | ||||
| 3 | 28 | 70 | 0.4 | ||
| 4 | 94 | 67.5 | 75 | 1.253333 | |
| 2008 | 1 | 106 | 72.5 | 80 | 1.325 |
| 2 | 82 | 77.5 | 85 | 0.964706 | |
| 3 | 48 | 82.5 | 91.75 | 0.523161 | |
| 4 | 114 | 87.5 | 100.75 | 1.131514 | |
| 2009 | 1 | 140 | 96 | 109.75 | 1.275626 |
| 2 | 120 | 105.5 | 119 | 1.008403 | |
| 3 | 82 | 114 | 126.75 | 0.646943 | |
| 4 | 154 | 124 | 132 | 1.166667 | |
| 2010 | 1 | 162 | 129.5 | 136.75 | 1.184644 |
| 2 | 140 | 134.5 | 141.5 | 0.989399 | |
| 3 | 100 | 139 | 147.25 | 0.679117 | |
| 4 | 174 | 144 | 154.5 | 1.126214 | |
| 2011 | 1 | 188 | 150.5 | 162 | 1.160494 |
| 2 | 172 | 158.5 | 168.5 | 1.020772 | |
| 3 | 128 | 165.5 | 174 | 0.735632 | |
| 4 | 198 | 171.5 | 180.25 | 1.098474 | |
| 2012 | 1 | 208 | 176.5 | 187.25 | 1.110814 |
| 2 | 202 | 184 | 193.25 | 1.045278 | |
| 3 | 154 | 190.5 | 200.75 | 0.767123 | |
| 4 | 220 | 196 | 210.25 | 1.046373 | |
| 2013 | 1 | 246 | 205.5 | 219.5 | 1.120729 |
| 2 | 240 | 215 | 228 | 1.052632 | |
| 3 | 190 | 224 | |||
| 4 | 252 | 232 |
The quarterly indexes are as follows:
| I | II | III | IV | |
| 2007 | 0.4 | 1.253333 | ||
| 2008 | 1.325 | 0.964706 | 0.523161 | 1.131514 |
| 2009 | 1.275626 | 1.008403 | 0.646943 | 1.166667 |
| 2010 | 1.184644 | 0.989399 | 0.679117 | 1.126214 |
| 2011 | 1.160494 | 1.020772 | 0.735632 | 1.098474 |
| 2012 | 1.110814 | 1.045278 | 0.767123 | 1.046373 |
| 2013 | 1.120729 | 1.052632 | ||
| Mean | 1.1962 | 1.0135 | 0.6253 | 1.1371 |
Seasonal index:
Here,
Therefore, the following is obtained:
The seasonal indexes are as follows:
| I | II | III | IV | |
| 2007 | 0.4 | 1.253333 | ||
| 2008 | 1.325 | 0.964706 | 0.523161 | 1.131514 |
| 2009 | 1.275626 | 1.008403 | 0.646943 | 1.166667 |
| 2010 | 1.184644 | 0.989399 | 0.679117 | 1.126214 |
| 2011 | 1.160494 | 1.020772 | 0.735632 | 1.098474 |
| 2012 | 1.110814 | 1.045278 | 0.767123 | 1.046373 |
| 2013 | 1.120729 | 1.052632 | ||
| Mean | 1.1962 | 1.0135 | 0.6253 | 1.1371 |
| Seasonal Index |
The total number of visitors in the year 2013 is
The 10% of 928 visitors is
The number of visitors in the year 2017 is
Therefore, the number of visitors in each quarter of 2017 is
Trend equation:
Step-by-step procedure to obtain the regression using the Excel:
- Enter the data for Year, Visitors and t in Excel sheet.
- Go to Data Menu.
- Click on Data Analysis.
- Select Regression and click on OK.
- Select the column of Visitors under Input Y Range.
- Select the column of t under Input X Range.
- Click on OK.
Output for the regression obtained using the Excel is as follows:
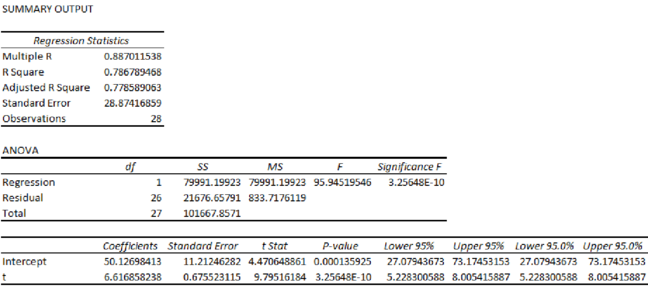
From the output, the regression equation is
Projection of the number of visitors for 2017:
The t value for the first quarter of 2014 is 29.
The t value for the second quarter of 2014 is 30.
The t value for the third quarter of 2014 is 31.
The t value for the fourth quarter of 2014 is 32.
Seasonally adjusted forecast:
| Estimated Visitors | Seasonal Index | |
| 242.0171 | 1.2046 | 291.5338 |
| 248.634 | 1.0206 | 253.7559 |
| 255.2509 | 0.6297 | 160.7315 |
| 261.8678 | 1.1451 | 299.8648 |
The seasonal index for the fourth quarter is high when compared to the remaining three quarters. Hence, the forecast for the fourth quarter is the best.
Want to see more full solutions like this?
Chapter 18 Solutions
STATISTICAL TECHNIQUES-ACCESS ONLY


- Suppose that the chance that an elementary student eats hot lunch is 30 percent. What’s the chance that, among 20 randomly selected students, between 6 and 8 students eat hot lunch (inclusive)?arrow_forwardBob’s commuting times to work are varied. He makes it to work on time 80 percent of the time. On 12 randomly selected trips to work, what’s the chance that Bob makes it on time at least 10 times?arrow_forwardYour chance of winning a small prize in a scratch-off ticket is 10 percent. You buy five tickets. What’s the chance you will win at least one prize?arrow_forward
- Suppose that 60 percent of families own a pet. You randomly sample four families. What is the chance that two or three of them own a pet?arrow_forwardIf 40 percent of university students purchase their textbooks online, in a random sample of five students, what’s the chance that exactly one of them purchased their textbooks online?arrow_forwardA stoplight is green 40 percent of the time. If you stop at this light eight random times, what is the chance that it’s green exactly five times?arrow_forward
- If 10 percent of the parts made by a certain company are defective and have to be remade, what is the chance that a random sample of four parts has one that is defective?arrow_forwardQuestion 4 Fourteen individuals were given a complex puzzle to complete. The times in seconds was recorded for their first and second attempts and the results provided below: 1 2 3 first attempt 172 255 second attempt 70 4 5 114 248 218 194 270 267 66 6 7 230 219 341 174 8 10 9 210 261 347 218 200 281 199 308 268 243 236 300 11 12 13 14 140 302 a. Calculate a 95% confidence interval for the mean time taken by each individual to complete the (i) first attempt and (ii) second attempt. [la] b. Test the hypothesis that the difference between the two mean times for both is 100 seconds. Use the 5% level of significance. c. Subsequently, it was learnt that the times for the second attempt were incorrecly recorded and that each of the values is 50 seconds too large. What, if any, difference does this make to the results of the test done in part (b)? Show all steps for the hypothesis testarrow_forwardQuestion 3 3200 students were asked about the importance of study groups in successfully completing their courses. They were asked to provide their current majors as well as their opinion. The results are given below: Major Opinion Psychology Sociology Economics Statistics Accounting Total Agree 144 183 201 271 251 1050 Disagree 230 233 254 227 218 1162 Impartial 201 181 196 234 176 988 Total 575 597 651 732 645 3200 a. State both the null and alternative hypotheses. b. Provide the decision rule for making this decision. Use an alpha level of 5%. c. Show all of the work necessary to calculate the appropriate statistic. | d. What conclusion are you allowed to draw? c. Would your conclusion change at the 10% level of significance? f. Confirm test results in part (c) using JASP. Note: All JASP input files and output tables should be providedarrow_forward
- Question 1 A tech company has acknowledged the importance of having records of all meetings conducted. The meetings are very fast paced and requires equipment that is able to capture the information in the shortest possible time. There are two options, using a typewriter or a word processor. Fifteen administrative assistants are selected and the amount of typing time in hours was recorded. The results are given below: 1 2 3 4 5 6 7 8 9 10 11 12 13 14 15 typewriter 8.0 6.5 5.0 6.7 7.8 8.5 7.2 5.7 9.2 5.7 6.5 word processor 7.2 5.7 8.3 7.5 9.2 7.2 6.5 7.0 6.9 34 7.0 6.9 8.8 6.7 8.8 9.4 8.6 5.5 7.2 8.4 a. Test the hypothesis that the mean typing time in hours for typewriters is less than 7.0. Use the 1% level of significance. b. Construct a 90% confidence interval for the difference in mean typing time in hours, where a difference is equal to the typing time in hours of word processors minus typing time in hours of typewriter. c. Using the 5% significance level, determine whether there is…arrow_forwardIllustrate 2/7×4/5 using a rectangular region. Explain your work. arrow_forwardWrite three other different proportions equivalent to the following using the same values as in the given proportion 3 foot over 1 yard equals X feet over 5 yardsarrow_forward
 Glencoe Algebra 1, Student Edition, 9780079039897...AlgebraISBN:9780079039897Author:CarterPublisher:McGraw Hill
 Trigonometry (MindTap Course List)TrigonometryISBN:9781305652224Author:Charles P. McKeague, Mark D. TurnerPublisher:Cengage Learning
 Holt Mcdougal Larson Pre-algebra: Student Edition...AlgebraISBN:9780547587776Author:HOLT MCDOUGALPublisher:HOLT MCDOUGAL
 College Algebra (MindTap Course List)AlgebraISBN:9781305652231Author:R. David Gustafson, Jeff HughesPublisher:Cengage Learning
 Big Ideas Math A Bridge To Success Algebra 1: Stu...AlgebraISBN:9781680331141Author:HOUGHTON MIFFLIN HARCOURTPublisher:Houghton Mifflin Harcourt