
Concept explainers
Videos
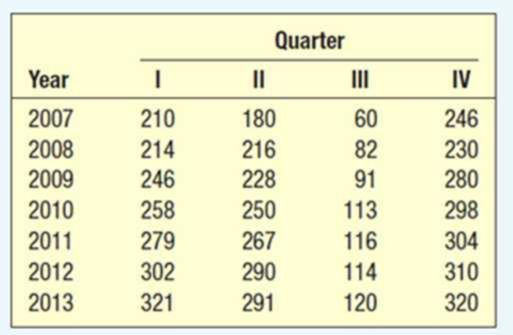
Sales of roof material, by quarter, for 2007 through 2013, by Carolina Home Construction Inc. are shown below (in $000).
- a. Determine the typical seasonal patterns for sales using the ratio-to-moving-average method.
- b. Deseasonalize the data and determine the trend equation.
- c. Project sales for 2014 using the trend equation and seasonally adjust these values to find the predicted sales for each quarter.
a.
Obtain the typical seasonal patterns for sales using the ratio-to-moving-average method.
Answer to Problem 30CE
The typical seasonal patterns for sales are 1.191168, 1.121778, 0.435094, and 1.251959.
Explanation of Solution
Four-year moving average:
Centered moving average:
Specific seasonal index:
Consider the following calculations:
| Year | Quarter | Visitors |
Four-quarter moving average |
Centered Moving average | Specific seasonal |
| 2007 | 1 | 210 | |||
| 2 | 180 | ||||
| 3 | 60 | 174.5 | 0.34384 | ||
| 4 | 246 | 174 | 179.5 | 1.370474 | |
| 2008 | 1 | 214 | 175 | 186.75 | 1.145917 |
| 2 | 216 | 184 | 187.5 | 1.152 | |
| 3 | 82 | 189.5 | 189.5 | 0.432718 | |
| 4 | 230 | 185.5 | 195 | 1.179487 | |
| 2009 | 1 | 246 | 193.5 | 197.625 | 1.244782 |
| 2 | 228 | 196.5 | 205 | 1.112195 | |
| 3 | 91 | 198.75 | 212.75 | 0.427732 | |
| 4 | 280 | 211.25 | 217 | 1.290323 | |
| 2010 | 1 | 258 | 214.25 | 222.5 | 1.159551 |
| 2 | 250 | 219.75 | 227.5 | 1.098901 | |
| 3 | 113 | 225.25 | 232.375 | 0.486283 | |
| 4 | 298 | 229.75 | 237.125 | 1.256721 | |
| 2011 | 1 | 279 | 235 | 239.625 | 1.164319 |
| 2 | 267 | 239.25 | 240.75 | 1.109034 | |
| 3 | 116 | 240 | 244.375 | 0.47468 | |
| 4 | 304 | 241.5 | 250.125 | 1.215392 | |
| 2012 | 1 | 302 | 247.25 | 252.75 | 1.194857 |
| 2 | 290 | 253 | 253.25 | 1.145114 | |
| 3 | 114 | 252.5 | 256.375 | 0.444661 | |
| 4 | 310 | 254 | 258.875 | 1.197489 | |
| 2013 | 1 | 321 | 258.75 | 259.75 | 1.235804 |
| 2 | 291 | 259 | 261.75 | 1.111748 | |
| 3 | 120 | 260.5 | |||
| 4 | 320 | 263 |
The quarterly indexes are as follows:
| I | II | III | IV | |
| 2007 | 0.34384 | 1.370474 | ||
| 2008 | 1.145917 | 1.152 | 0.432718 | 1.179487 |
| 2009 | 1.244782 | 1.112195 | 0.427732 | 1.290323 |
| 2010 | 1.159551 | 1.098901 | 0.486283 | 1.256721 |
| 2011 | 1.164319 | 1.109034 | 0.47468 | 1.215392 |
| 2012 | 1.194857 | 1.145114 | 0.444661 | 1.197489 |
| 2013 | 1.235804 | 1.111748 | ||
| Mean | 1.190871 | 1.121499 | 0.434986 | 1.251648 |
Typical seasonal index:
Here,
Therefore, the following is obtained:
The seasonal indexes are given below:
| I | II | III | IV | |
| 2007 | 0.34384 | 1.370474 | ||
| 2008 | 1.145917 | 1.152 | 0.432718 | 1.179487 |
| 2009 | 1.244782 | 1.112195 | 0.427732 | 1.290323 |
| 2010 | 1.159551 | 1.098901 | 0.486283 | 1.256721 |
| 2011 | 1.164319 | 1.109034 | 0.47468 | 1.215392 |
| 2012 | 1.194857 | 1.145114 | 0.444661 | 1.197489 |
| 2013 | 1.235804 | 1.111748 | ||
| Mean | 1.190871 | 1.121499 | 0.434986 | 1.251648 |
| Typical Seasonal Index | 1.191168 | 1.121778 | 0.435094 | 1.251959 |
b.
Compute the trend equation.
Answer to Problem 30CE
The trend equation is
Explanation of Solution
Deseasonalization:
| Sales | Typical seasonal index | Deseasonalized Sales |
| 210 | 1.191168 | 176.29755 |
| 180 | 1.121778 | 160.4595562 |
| 60 | 0.435094 | 137.9012351 |
| 246 | 1.251959 | 196.4920576 |
| 214 | 1.191168 | 179.6555985 |
| 216 | 1.121778 | 192.5514674 |
| 82 | 0.435094 | 188.4650214 |
| 230 | 1.251959 | 183.7120864 |
| 246 | 1.191168 | 206.5199871 |
| 228 | 1.121778 | 203.2487711 |
| 91 | 0.435094 | 209.1502066 |
| 280 | 1.251959 | 223.6494965 |
| 258 | 1.191168 | 216.5941328 |
| 250 | 1.121778 | 222.8604947 |
| 113 | 0.435094 | 259.7139928 |
| 298 | 1.251959 | 238.0269641 |
| 279 | 1.191168 | 234.2238878 |
| 267 | 1.121778 | 238.0150083 |
| 116 | 0.435094 | 266.6090546 |
| 304 | 1.251959 | 242.8194534 |
| 302 | 1.191168 | 253.5326671 |
| 290 | 1.121778 | 258.5181738 |
| 114 | 0.435094 | 262.0123468 |
| 310 | 1.251959 | 247.6119426 |
| 321 | 1.191168 | 269.4833978 |
| 291 | 1.121778 | 259.4096158 |
| 120 | 0.435094 | 275.8024703 |
| 320 | 1.251959 | 255.5994246 |
Assign t value as 1 for the first quarter of 2007, 2 for the second quarter of 2008, and so on.
Step-by-step procedure to obtain the regression using the Excel:
- Enter the data for Sales and t in Excel sheet.
- Go to Data Menu.
- Click on Data Analysis.
- Select Regression and click on OK.
- Select the column of Deseasonalized Sales under Input Y Range.
- Select the column of t under Input X Range.
- Click on OK.
Output for the regression obtained using the Excel is as follows:
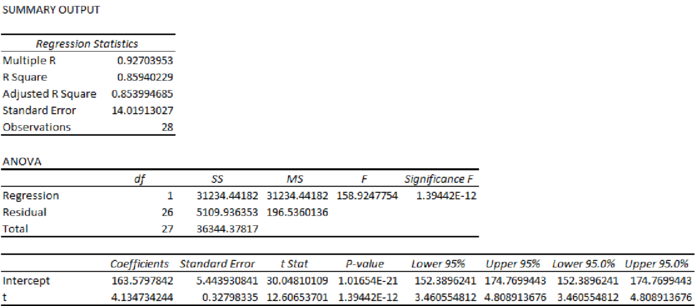
From the Excel output, the regression equation is
c.
Predict the sales for the four quarters of 2014 using the trend equation.
Find the seasonally adjusted values.
Answer to Problem 30CE
The sales for the four quarters for 2014 are 283.487, 287.6217, 291.7564, and 295.8911.
The seasonally adjusted values are 337.6806, 322.6477, 126.9415, and 370.4435.
Explanation of Solution
From the output, the regression equation is
The t value for the first quarter of 2014 is 29.
The t value for the second quarter of 2014 is 30.
The t value for the third quarter of 2014 is 31.
The t value for the fourth quarter of 2014 is 32.
Seasonally adjusted forecast:
| Estimated Visitors | Seasonal Index | |
| 283.487 | 1.191168 | 337.6806 |
| 287.6217 | 1.121778 | 322.6477 |
| 291.7564 | 0.435094 | 126.9415 |
| 295.8911 | 1.251959 | 370.4435 |
Want to see more full solutions like this?
Chapter 18 Solutions
STATISTICAL TECHNIQUES-ACCESS ONLY


- if the b coloumn of a z table disappeared what would be used to determine b column probabilitiesarrow_forwardConstruct a model of population flow between metropolitan and nonmetropolitan areas of a given country, given that their respective populations in 2015 were 263 million and 45 million. The probabilities are given by the following matrix. (from) (to) metro nonmetro 0.99 0.02 metro 0.01 0.98 nonmetro Predict the population distributions of metropolitan and nonmetropolitan areas for the years 2016 through 2020 (in millions, to four decimal places). (Let x, through x5 represent the years 2016 through 2020, respectively.) x₁ = x2 X3 261.27 46.73 11 259.59 48.41 11 257.96 50.04 11 256.39 51.61 11 tarrow_forwardIf the average price of a new one family home is $246,300 with a standard deviation of $15,000 find the minimum and maximum prices of the houses that a contractor will build to satisfy 88% of the market valuearrow_forward
- 21. ANALYSIS OF LAST DIGITS Heights of statistics students were obtained by the author as part of an experiment conducted for class. The last digits of those heights are listed below. Construct a frequency distribution with 10 classes. Based on the distribution, do the heights appear to be reported or actually measured? Does there appear to be a gap in the frequencies and, if so, how might that gap be explained? What do you know about the accuracy of the results? 3 4 555 0 0 0 0 0 0 0 0 0 1 1 23 3 5 5 5 5 5 5 5 5 5 5 5 5 6 6 8 8 8 9arrow_forwardA side view of a recycling bin lid is diagramed below where two panels come together at a right angle. 45 in 24 in Width? — Given this information, how wide is the recycling bin in inches?arrow_forward1 No. 2 3 4 Binomial Prob. X n P Answer 5 6 4 7 8 9 10 12345678 8 3 4 2 2552 10 0.7 0.233 0.3 0.132 7 0.6 0.290 20 0.02 0.053 150 1000 0.15 0.035 8 7 10 0.7 0.383 11 9 3 5 0.3 0.132 12 10 4 7 0.6 0.290 13 Poisson Probability 14 X lambda Answer 18 4 19 20 21 22 23 9 15 16 17 3 1234567829 3 2 0.180 2 1.5 0.251 12 10 0.095 5 3 0.101 7 4 0.060 3 2 0.180 2 1.5 0.251 24 10 12 10 0.095arrow_forward
- step by step on Microssoft on how to put this in excel and the answers please Find binomial probability if: x = 8, n = 10, p = 0.7 x= 3, n=5, p = 0.3 x = 4, n=7, p = 0.6 Quality Control: A factory produces light bulbs with a 2% defect rate. If a random sample of 20 bulbs is tested, what is the probability that exactly 2 bulbs are defective? (hint: p=2% or 0.02; x =2, n=20; use the same logic for the following problems) Marketing Campaign: A marketing company sends out 1,000 promotional emails. The probability of any email being opened is 0.15. What is the probability that exactly 150 emails will be opened? (hint: total emails or n=1000, x =150) Customer Satisfaction: A survey shows that 70% of customers are satisfied with a new product. Out of 10 randomly selected customers, what is the probability that at least 8 are satisfied? (hint: One of the keyword in this question is “at least 8”, it is not “exactly 8”, the correct formula for this should be = 1- (binom.dist(7, 10, 0.7,…arrow_forwardKate, Luke, Mary and Nancy are sharing a cake. The cake had previously been divided into four slices (s1, s2, s3 and s4). What is an example of fair division of the cake S1 S2 S3 S4 Kate $4.00 $6.00 $6.00 $4.00 Luke $5.30 $5.00 $5.25 $5.45 Mary $4.25 $4.50 $3.50 $3.75 Nancy $6.00 $4.00 $4.00 $6.00arrow_forwardFaye cuts the sandwich in two fair shares to her. What is the first half s1arrow_forward
- Question 2. An American option on a stock has payoff given by F = f(St) when it is exercised at time t. We know that the function f is convex. A person claims that because of convexity, it is optimal to exercise at expiration T. Do you agree with them?arrow_forwardQuestion 4. We consider a CRR model with So == 5 and up and down factors u = 1.03 and d = 0.96. We consider the interest rate r = 4% (over one period). Is this a suitable CRR model? (Explain your answer.)arrow_forwardQuestion 3. We want to price a put option with strike price K and expiration T. Two financial advisors estimate the parameters with two different statistical methods: they obtain the same return rate μ, the same volatility σ, but the first advisor has interest r₁ and the second advisor has interest rate r2 (r1>r2). They both use a CRR model with the same number of periods to price the option. Which advisor will get the larger price? (Explain your answer.)arrow_forward
 Glencoe Algebra 1, Student Edition, 9780079039897...AlgebraISBN:9780079039897Author:CarterPublisher:McGraw Hill
 Holt Mcdougal Larson Pre-algebra: Student Edition...AlgebraISBN:9780547587776Author:HOLT MCDOUGALPublisher:HOLT MCDOUGAL
 Big Ideas Math A Bridge To Success Algebra 1: Stu...AlgebraISBN:9781680331141Author:HOUGHTON MIFFLIN HARCOURTPublisher:Houghton Mifflin Harcourt
 College Algebra (MindTap Course List)AlgebraISBN:9781305652231Author:R. David Gustafson, Jeff HughesPublisher:Cengage Learning
 Trigonometry (MindTap Course List)TrigonometryISBN:9781305652224Author:Charles P. McKeague, Mark D. TurnerPublisher:Cengage Learning
 Functions and Change: A Modeling Approach to Coll...AlgebraISBN:9781337111348Author:Bruce Crauder, Benny Evans, Alan NoellPublisher:Cengage Learning