
Concept explainers
Videos
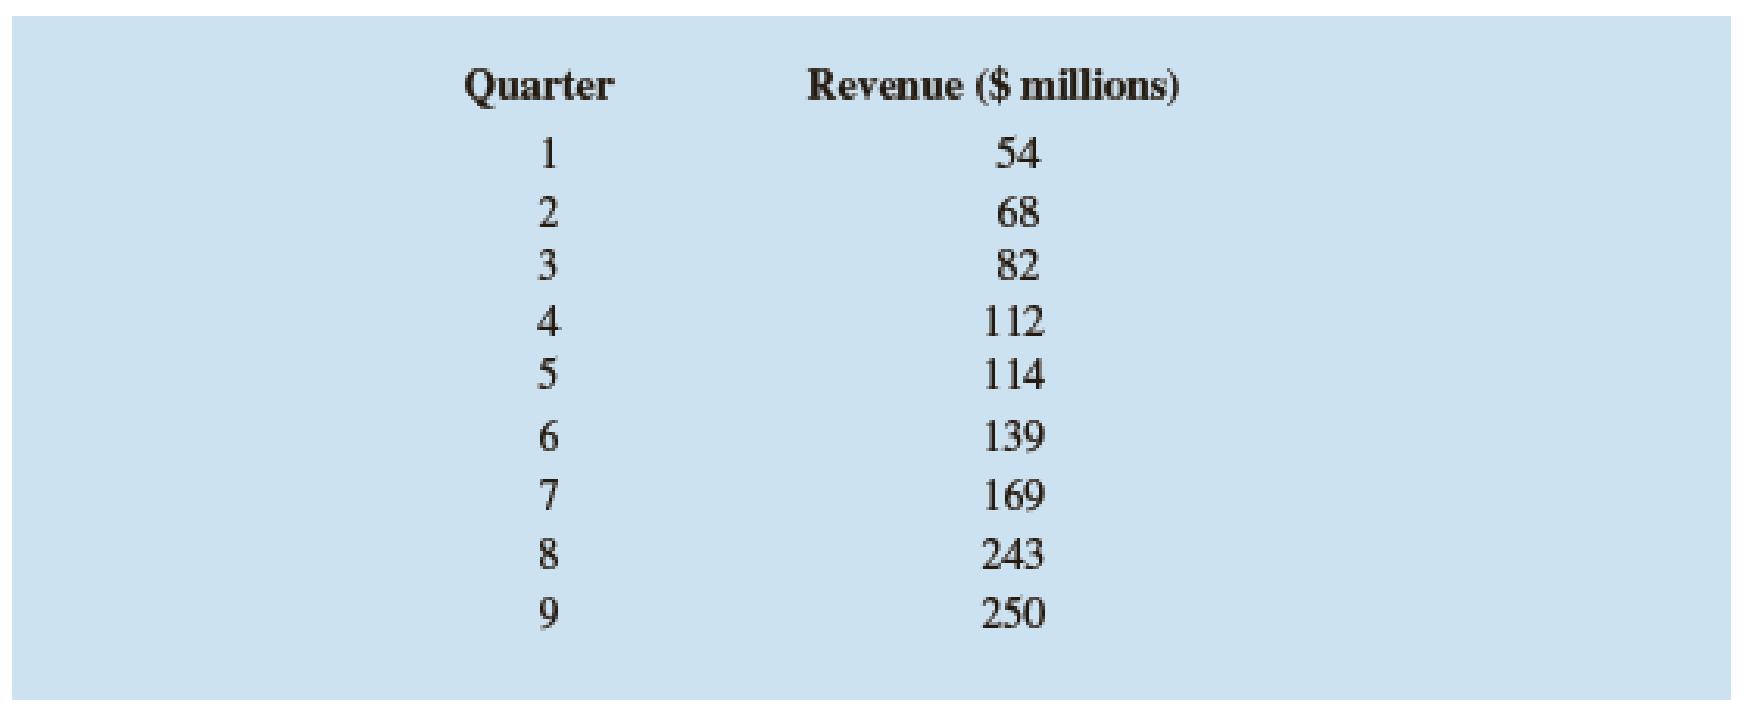
Quarterly revenue ($ millions) for Twitter for the first quarter of 2012 through the first quarter of 2014 are shown below (adexchange.com, April 2015):
- a. Construct a time series plot. What type of pattern exists in the data?
- b. Using Excel or Minitab, develop a linear trend equation for this time series.
- c. Using Excel or Minitab, develop a
quadratic trend equation for this time series. - d. Compare the MSE for each model. Which model appears better according to MSE?
- e. Use the models developed in parts (b) and (c) to forecast revenue for the tenth quarter.
- f. Which of the two forecasts in part (e) would you use? Explain.
a.
Construct the time series plot.
Explain the type of pattern.
Answer to Problem 25E
The time series plot is given below:
The pattern that appears in the graph is the upward trend.
Explanation of Solution
Calculation:
The given data shows the quarterly revenue for the first quarter of 2012 to the first quarter of 2014.
Software procedure:
Step-by-step software procedure to draw the time series plot using EXCEL:
- Open an EXCEL file.
- In column A, enter the data of Quarter, and in column B, enter the corresponding values of Revenue.
- Select the data that are to be displayed.
- Click on the Insert Tab > select Scatter icon.
- Choose a Scatter with Straight Lines and Markers.
- Click on the chart > select Layout from the Chart Tools.
- Select Chart Title > Above Chart and enter Time Series Plot.
- Select Axis Title > Primary Horizontal Axis Title > Title Below Axis.
- Enter Quarter in the dialog box.
- Select Axis Title > Primary Vertical Axis Title > Rotated Title.
- Enter Revenue in the dialog box.
From the output, the line of graph represents the increase of revenue from year to year.
Thus, the pattern of the graph represents the upward trend.
b.
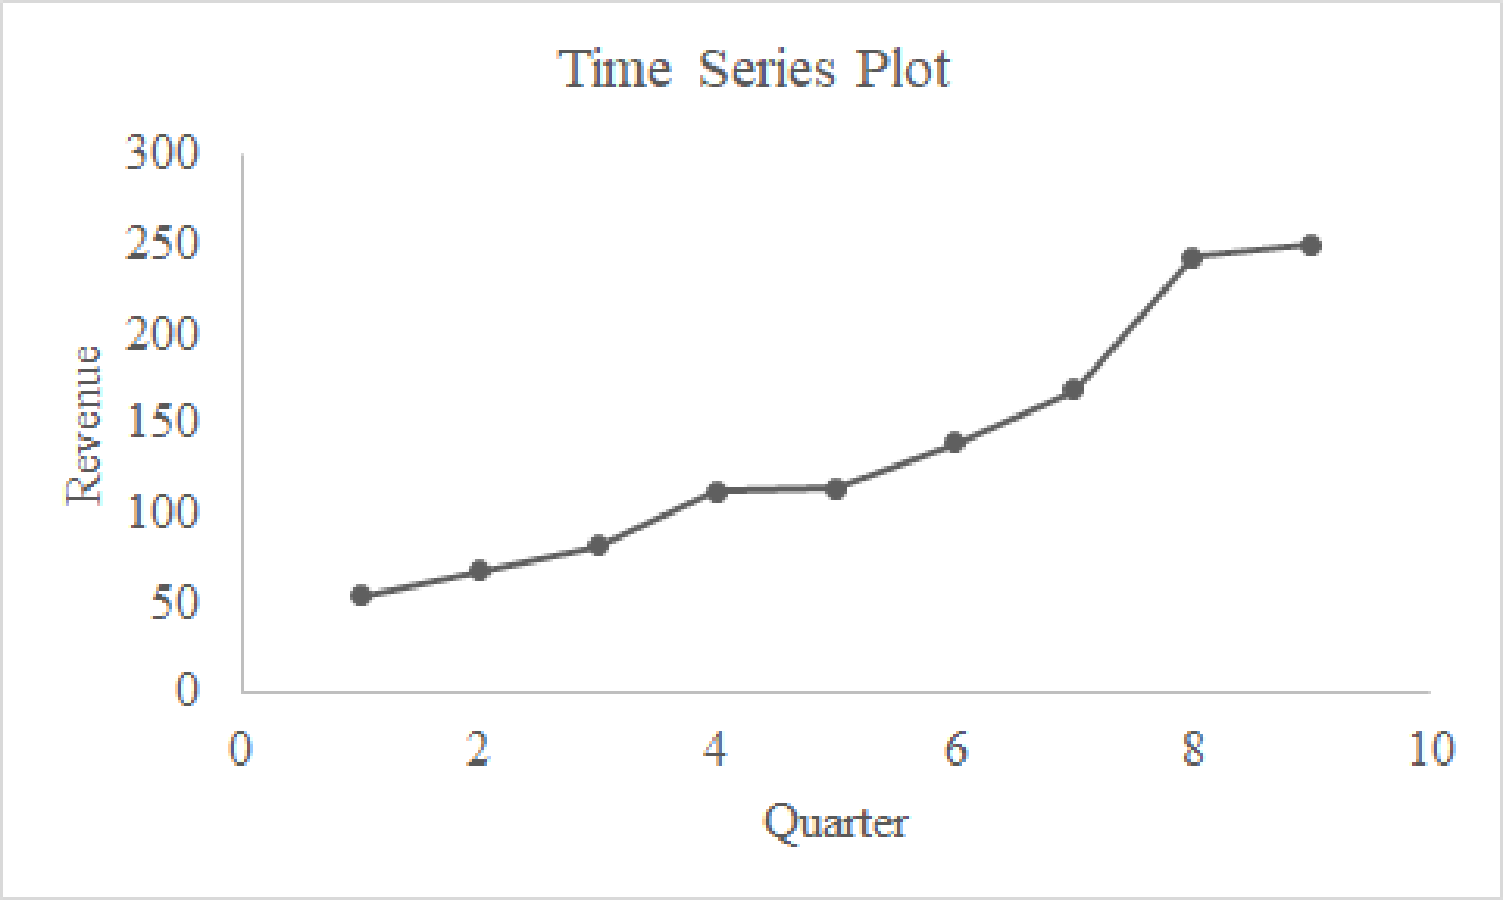
Find the linear trend equation for the data.
Answer to Problem 25E
The linear trend equation is
Explanation of Solution
Calculation:
The linear trend equation is to be obtained.
Software procedure:
Step-by-step software procedure to find the linear trend equation using EXCEL:
- Open an EXCEL file.
- In column A, enter the data of Quarter, and in column B, enter the corresponding values of Revenue.
- Select the data that are to be displayed.
- Click on the Insert Tab > select Scatter icon.
- Choose a Scatter with Straight Lines and Markers.
- Click on the chart > select Layout from the Chart Tools.
- Select Chart Title > Above Chart and enter Time Series Plot.
- Select Axis Title > Primary Horizontal Axis Title > Title Below Axis.
- Enter Quarter in the dialog box.
- Select Axis Title > Primary Vertical Axis Title > Rotated Title.
- Enter Revenue in the dialog box.
- Right Click at any point in the time series plot and select Add Trendline.
- Select Linear under TrendLine Options.
- Choose Display Equation on Chart.
Output using EXCEL is given below:
From the output, the linear trend equation is
c.
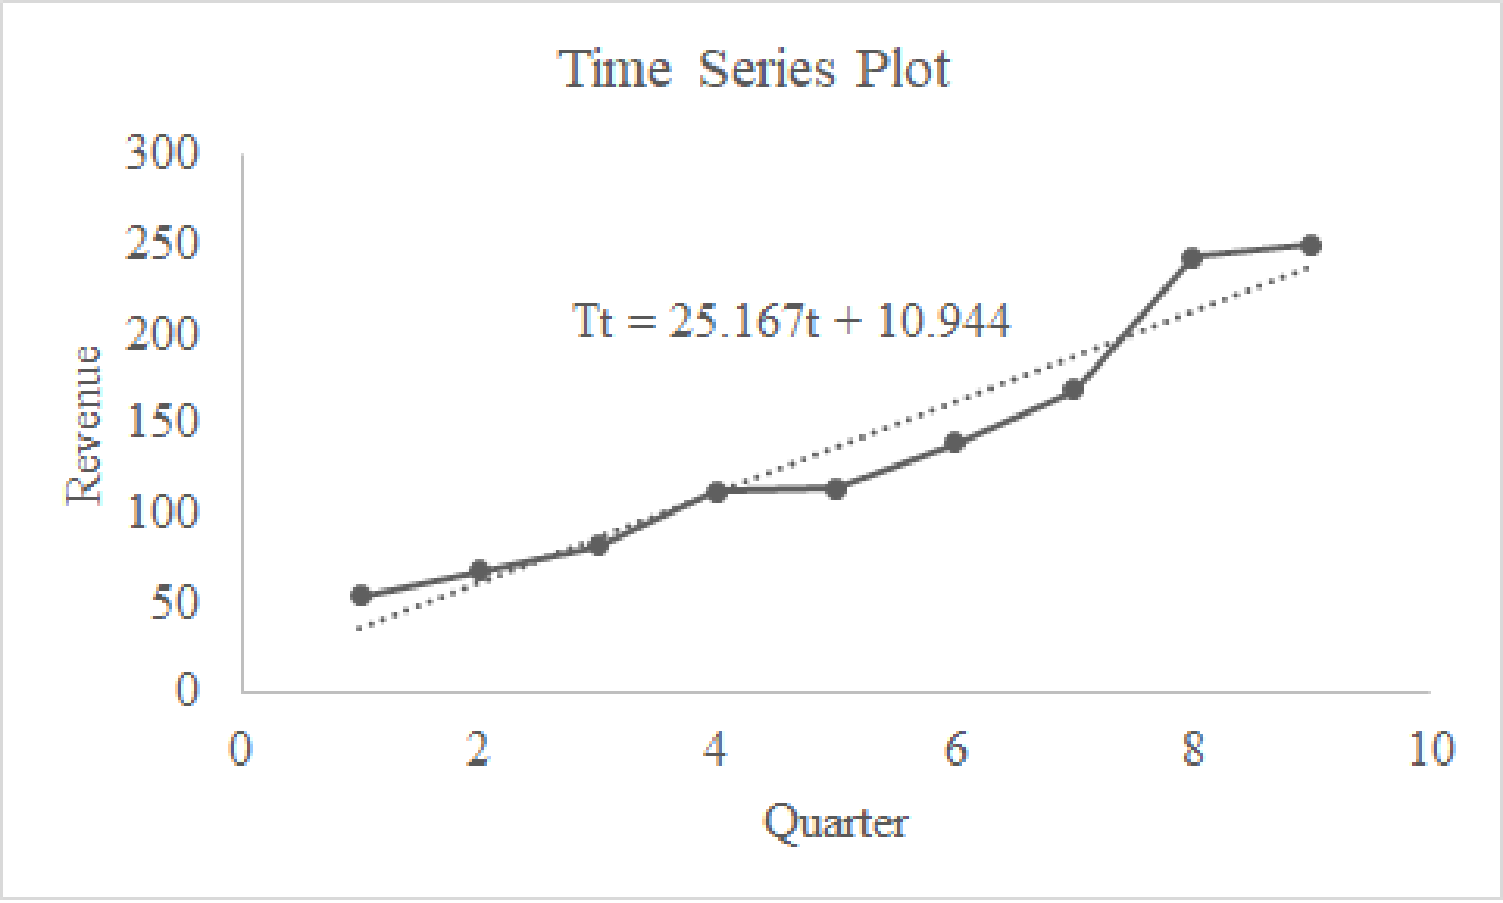
Find the quadratic trend equation for the data.
Answer to Problem 25E
The quadratic trend equation is
Explanation of Solution
Calculation:
The quadratic trend equation is to be obtained.
Software procedure:
Step-by-step software procedure to find the linear trend equation using EXCEL:
- Open an EXCEL file.
- In column A, enter the data of Quarter, and in column B, enter the corresponding values of Revenue.
- Select the data that are to be displayed.
- Click on the Insert Tab > select Scatter icon.
- Choose a Scatter with Straight Lines and Markers.
- Click on the chart > select Layout from the Chart Tools.
- Select Chart Title > Above Chart and enter Time Series Plot.
- Select Axis Title > Primary Horizontal Axis Title > Title Below Axis.
- Enter Quarter in the dialog box.
- Select Axis Title > Primary Vertical Axis Title > Rotated Title.
- Enter Revenue in the dialog box.
- Right Click at any point in the time series plot and select Add Trendline.
- Select Polynomial and enter Order as 2 under TrendLine Options.
- Choose Display Equation on Chart.
Output using EXCEL is given below:
From the output, the quadratic trend equation is
d.
Identify the model that appears better according to MSE.
Answer to Problem 25E
The quadratic model that appears better according to MSE.
Explanation of Solution
Calculation:
The formula for finding mean square error (MSE) is as follows:
For linear trend model:
Software procedure:
Step-by-step procedure to obtain MSE using EXCEL:
- In column A, enter the data of Quarter, and in column B, enter the corresponding values of Revenue.
- In Data, select Data Analysis and choose Regression.
- In Input Y Range, select Revenue.
- In Input X Range, select Quarter.
- Select Labels.
- Click OK.
Output obtained using EXCEL is given below:
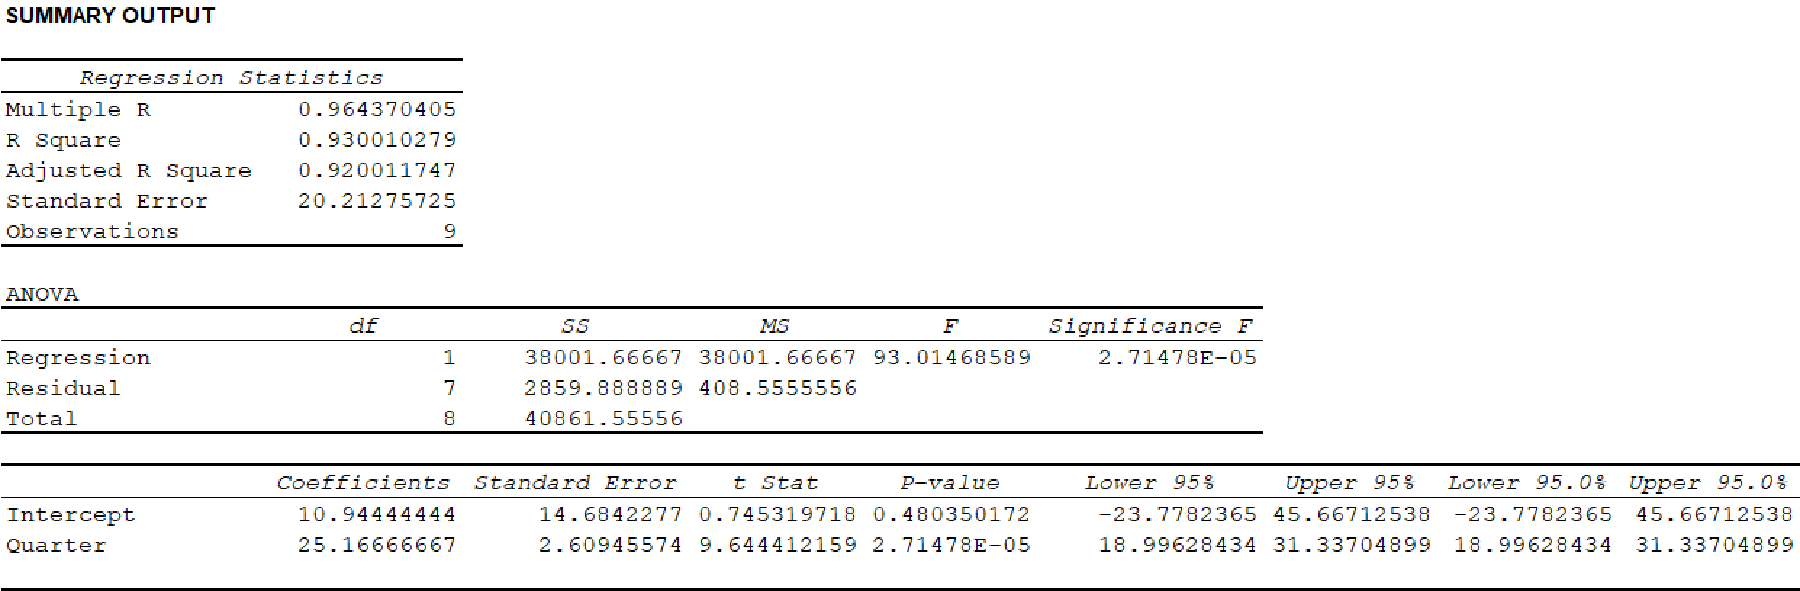
From the output, the MSE is 408.5556.
For Quadratic trend model:
Software procedure:
Step-by-step procedure to obtain MSE using EXCEL:
- In column A, enter the data of Quarter, in column B, enter the data of Quarter Square and in column C, enter the corresponding values of Revenue.
- In Data, select Data Analysis and choose Regression.
- In Input Y Range, select Revenue.
- In Input X Range, select Quarter and Quarter Square.
- Select Labels.
- Click OK.
Output obtained using EXCEL is given below:
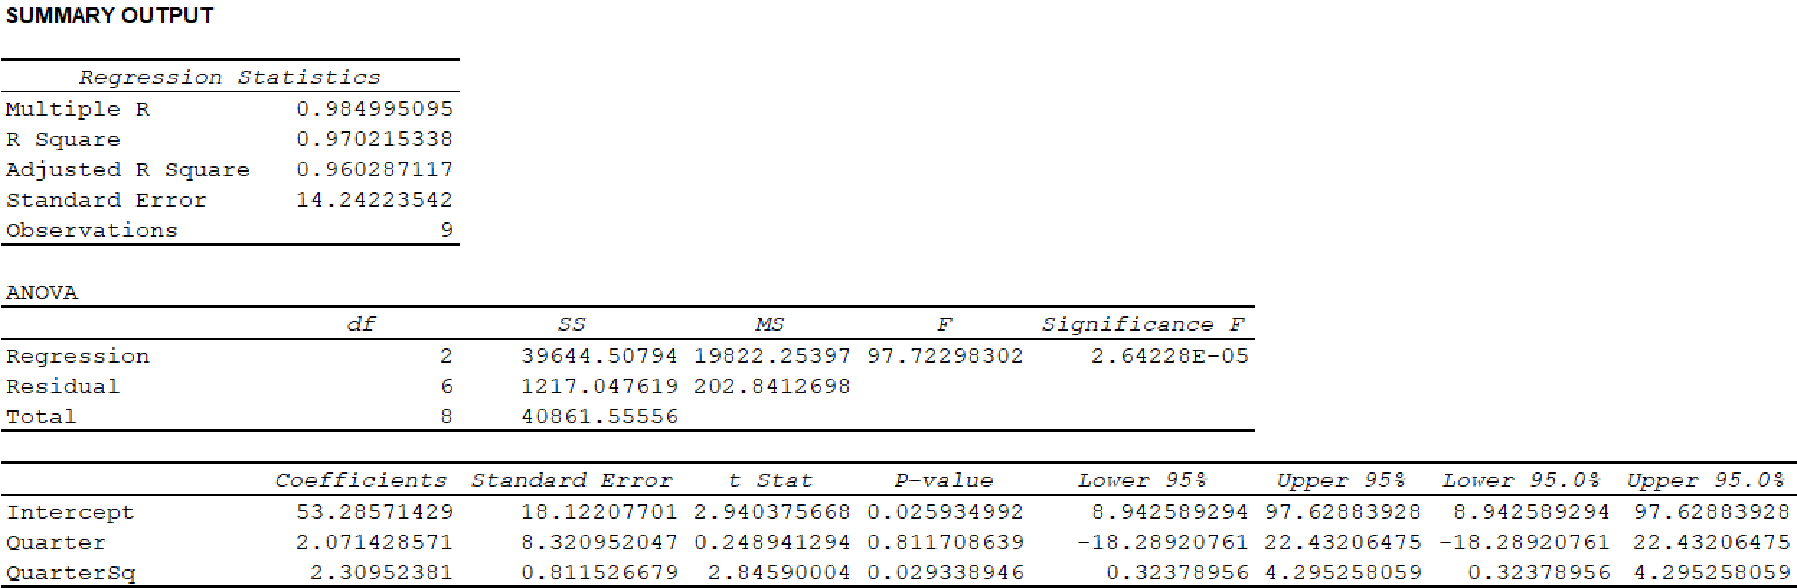
From the output, MSE is 202.8413.
Here, MSE for the quadratic trend equation is less than MSE for the linear trend equation. Hence, the quadratic model provides more accurate forecasts based on MSE.
e.
Find the forecast revenue for the tenth quarter using the models developed in Parts (b) and (c).
Answer to Problem 25E
The forecast revenue for the tenth quarter using the linear model is 262.614.
The forecast revenue for the tenth quarter using the quadratic model is 304.95.
Explanation of Solution
Calculation:
From the results of Part (b), the trend line equation is
The forecast revenue for the tenth quarter using the linear model is obtained as follows:
Thus, the forecast revenue for the tenth quarter using the linear model is 262.614.
From the results of Part (b), the trend line equation is
The forecast revenue for the tenth quarter using the quadratic model is obtained as follows:
Thus, the forecast revenue for the tenth quarter using the linear model is 262.614.
f.
Identify the forecast that is used in Part (e).
Answer to Problem 25E
The forecast revenue for the tenth quarter using the quadratic models is used.
Explanation of Solution
From Part (d), MSE for the quadratic trend equation is less than MSE for the linear trend equation. Hence, the quadratic model provides more accurate forecasts based on MSE. Thus, the forecast revenue for the tenth quarter using the quadratic models is used.
Want to see more full solutions like this?
Chapter 17 Solutions
Modern Business Statistics with Microsoft Office Excel (with XLSTAT Education Edition Printed Access Card) (MindTap Course List)


- Question 6: Negate the following compound statements, using De Morgan's laws. A) If Alberta was under water entirely then there should be no fossil of mammals.arrow_forwardNegate the following compound statement using De Morgans's laws.arrow_forwardCharacterize (with proof) all connected graphs that contain no even cycles in terms oftheir blocks.arrow_forward
- Let G be a connected graph that does not have P4 or C3 as an induced subgraph (i.e.,G is P4, C3 free). Prove that G is a complete bipartite grapharrow_forwardProve sufficiency of the condition for a graph to be bipartite that is, prove that if G hasno odd cycles then G is bipartite as follows:Assume that the statement is false and that G is an edge minimal counterexample. That is, Gsatisfies the conditions and is not bipartite but G − e is bipartite for any edge e. (Note thatthis is essentially induction, just using different terminology.) What does minimality say aboutconnectivity of G? Can G − e be disconnected? Explain why if there is an edge between twovertices in the same part of a bipartition of G − e then there is an odd cyclearrow_forwardLet G be a connected graph that does not have P4 or C4 as an induced subgraph (i.e.,G is P4, C4 free). Prove that G has a vertex adjacent to all othersarrow_forward
- We consider a one-period market with the following properties: the current stock priceis S0 = 4. At time T = 1 year, the stock has either moved up to S1 = 8 (with probability0.7) or down towards S1 = 2 (with probability 0.3). We consider a call option on thisstock with maturity T = 1 and strike price K = 5. The interest rate on the money marketis 25% yearly.(a) Find the replicating portfolio (φ, ψ) corresponding to this call option.(b) Find the risk-neutral (no-arbitrage) price of this call option.(c) We now consider a put option with maturity T = 1 and strike price K = 3 onthe same market. Find the risk-neutral price of this put option. Reminder: A putoption gives you the right to sell the stock for the strike price K.1(d) An investor with initial capital X0 = 0 wants to invest on this market. He buysα shares of the stock (or sells them if α is negative) and buys β call options (orsells them is β is negative). He invests the cash balance on the money market (orborrows if the amount is…arrow_forwardDetermine if the two statements are equivalent using a truth tablearrow_forwardQuestion 4: Determine if pair of statements A and B are equivalent or not, using truth table. A. (~qp)^~q в. р л~9arrow_forward
- Determine if the two statements are equalivalent using a truth tablearrow_forwardQuestion 3: p and q represent the following simple statements. p: Calgary is the capital of Alberta. A) Determine the value of each simple statement p and q. B) Then, without truth table, determine the va q: Alberta is a province of Canada. for each following compound statement below. pvq р^~q ~рл~q ~q→ p ~P~q Pq b~ (d~ ← b~) d~ (b~ v d) 0 4arrow_forward2. Let X be a random variable. (a) Show that, if E X2 = 1 and E X4arrow_forwardarrow_back_iosSEE MORE QUESTIONSarrow_forward_ios
 Trigonometry (MindTap Course List)TrigonometryISBN:9781305652224Author:Charles P. McKeague, Mark D. TurnerPublisher:Cengage Learning
 Glencoe Algebra 1, Student Edition, 9780079039897...AlgebraISBN:9780079039897Author:CarterPublisher:McGraw Hill
 Big Ideas Math A Bridge To Success Algebra 1: Stu...AlgebraISBN:9781680331141Author:HOUGHTON MIFFLIN HARCOURTPublisher:Houghton Mifflin Harcourt
 College Algebra (MindTap Course List)AlgebraISBN:9781305652231Author:R. David Gustafson, Jeff HughesPublisher:Cengage Learning
 Holt Mcdougal Larson Pre-algebra: Student Edition...AlgebraISBN:9780547587776Author:HOLT MCDOUGALPublisher:HOLT MCDOUGAL