
Excursions In Modern Mathematics, 9th Edition
9th Edition
ISBN: 9780134494142
Author: Tannenbaum
Publisher: PEARSON
expand_more
expand_more
format_list_bulleted
Concept explainers
Videos
Textbook Question
Chapter 17, Problem 4E
Consider the
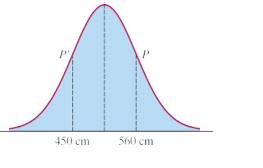
Figure 17-15
a. Find the median M of the distribution.
b. Find the standard deviation
c. Find the third quartile
d. Find the first quartile
Expert Solution & Answer
Want to see the full answer?
Check out a sample textbook solution
Students have asked these similar questions
3) Recall that the power set of a set A is the set of all subsets of A: PA = {S: SC A}.
Prove the following proposition.
АСВ РАСРВ
A sequence X = (xn) is said to be a contractive sequence if there is a constant 0 < C < 1 so
that
for all n = N.
-
|Xn+1 − xn| ≤ C|Xn — Xn−1|
-
3) Find the surface area of z
-1≤ y ≤1
=
1 + x + y + x2 over the rectangle −2 ≤ x ≤ 1 and
-
Solution: TYPE YOUR SOLUTION HERE! ALSO: Generate a plot of the surface
in Mathematica and include that plot in your solution!
Chapter 17 Solutions
Excursions In Modern Mathematics, 9th Edition
Ch. 17 - Consider the normal distribution represented by...Ch. 17 - Consider the normal distribution represented by...Ch. 17 - Consider the normal distribution represented by...Ch. 17 - Consider the normal distribution represented by...Ch. 17 - Consider a normal distribution with mean =81.2lb...Ch. 17 - Consider a normal distribution with mean =2354...Ch. 17 - Consider a normal distribution with first quartile...Ch. 17 - Consider a normal distribution with first quartile...Ch. 17 - Estimate the value of the standard deviation ...Ch. 17 - Estimate the value of the standard deviation ...
Ch. 17 - Explain why a distribution with median M=82, mean...Ch. 17 - Explain why a distribution with median M=453, mean...Ch. 17 - Explain why a distribution with =195, Q1=180 and...Ch. 17 - Explain why a distribution with M==47, Q1=35 and...Ch. 17 - A normal distribution has mean =30kg and standard...Ch. 17 - Prob. 16ECh. 17 - Prob. 17ECh. 17 - Prob. 18ECh. 17 - Prob. 19ECh. 17 - In a normal distribution with mean =83.2 and...Ch. 17 - Prob. 21ECh. 17 - Prob. 22ECh. 17 - Prob. 23ECh. 17 - Prob. 24ECh. 17 - Prob. 25ECh. 17 - In a normal distribution with standard deviation...Ch. 17 - Prob. 27ECh. 17 - Prob. 28ECh. 17 - Consider the normal distribution represented by...Ch. 17 - Consider the normal distribution represented by...Ch. 17 - Consider the normal distribution defined by Fig....Ch. 17 - Consider the normal distribution defined by Fig....Ch. 17 - A normal distribution has mean =71.5in., and the...Ch. 17 - A normal distribution has standard deviation =12.3...Ch. 17 - Prob. 35ECh. 17 - Prob. 36ECh. 17 - Prob. 37ECh. 17 - A normal distribution has mean =500 and standard...Ch. 17 - In a normal distribution, what percent of the data...Ch. 17 - In a normal distribution, what percent of the data...Ch. 17 - Exercises 41 through 44 refer to the following:...Ch. 17 - Exercises 41 through 44 refer to the following:...Ch. 17 - Exercises 41 through 44 refer to the following:...Ch. 17 - Exercises 41 through 44 refer to the following:...Ch. 17 - Exercises 45 through 48 refer to the following: As...Ch. 17 - Exercises 45 through 48 refer to the following: As...Ch. 17 - Exercises 45 through 48 refer to the following: As...Ch. 17 - Exercises 45 through 48 refer to the following: As...Ch. 17 - Exercises 49 through 52 refer to the following:...Ch. 17 - Exercises 49 through 52 refer to the following:...Ch. 17 - Exercises 49 through 52 refer to the following:...Ch. 17 - Exercises 49 through 52 refer to the following:...Ch. 17 - Exercises 53 through 56 refer to the distribution...Ch. 17 - Exercises 53 through 56 refer to the distribution...Ch. 17 - Exercises 53 through 56 refer to the distribution...Ch. 17 - Exercises 53 through 56 refer to the distribution...Ch. 17 - An honest coin is tossed n=3600 times. Let the...Ch. 17 - Prob. 58ECh. 17 - Suppose that a random sample of n=7056 adults is...Ch. 17 - An honest die is rolled. If the roll comes out...Ch. 17 - A dishonest coin with probability of heads p=0.4...Ch. 17 - A dishonest coin with probability of heads p=0.75...Ch. 17 - Prob. 63ECh. 17 - Suppose that 1 out of every 10 plasma televisions...Ch. 17 - Prob. 65ECh. 17 - Prob. 66ECh. 17 - Percentiles. The pth percentile of a sorted data...Ch. 17 - Prob. 68ECh. 17 - Prob. 69ECh. 17 - Percentiles. The pth percentile of a sorted data...Ch. 17 - Prob. 71ECh. 17 - Percentiles. The pth percentile of a sorted data...Ch. 17 - Prob. 73ECh. 17 - Prob. 74ECh. 17 - Prob. 75ECh. 17 - Prob. 76ECh. 17 - A dishonest coin with probability of heads p=0.1...Ch. 17 - Prob. 78ECh. 17 - In American roulette there are 18 red numbers, 18...Ch. 17 - After polling a random sample of 800 voters during...
Knowledge Booster


Learn more about
Need a deep-dive on the concept behind this application? Look no further. Learn more about this topic, subject and related others by exploring similar questions and additional content below.Similar questions
- 7. Walkabout. Does this graph have an Euler circuit? If so, find one. If not, explain why not.arrow_forwardBelow, let A, B, and C be sets. 1) Prove (AUB) nC = (ANC) U (BNC).arrow_forwardQ1: find the Reliability of component in the system in fig(1) by minimal cut method. Q2: A component A with constant failure rate 1.5 per 1000 h, B per to 2 in 1000h, A and B in parallel, find the Reliability system? [ by exponential distribution]. Q3: Give an example to find the minimal path and estimate the reliability of this block diagram. Q4: By Tie set method find the Reliability of fig (2) FUZarrow_forward
- A sequence X = (xn) is said to be a contractive sequence if there is a constant 0 < C < 1 so that for all n = N. - |Xn+1 − xn| ≤ C|Xn — Xn−1| -arrow_forward1) Suppose continuous random variable X has sample space S = [1, ∞) and a pdf of the form f(x) = Ce-(2-1)/2. What is the expected value of X?arrow_forwardA sequence X = (xn) is said to be a contractive sequence if there is a constant 0 < C < 1 so that for all n = N. - |Xn+1 − xn| ≤ C|Xn — Xn−1| -arrow_forward
- 1) Find the equation of the tangent line to the graph y=xe at the point (1, 1).arrow_forward3) Suppose that f is differentiable on [0, 5], and f'(x) ≤ 3 over this interval. If f(0) = −1, what is the maximum possible value of f(5)?arrow_forward2) Find the general solution to the differential equation d²x dt² 2 dax = dtarrow_forward
- 2) Prove (AB) UC = (AUC)n (BUC).arrow_forward2) Find the maximum value of f(x, y) = x - y on the circle x² + y² - 4x - 2y - 4 = 0.arrow_forwardBlue Ridge Hot Tubs manufactures and sells two models of hot tubs: the Aqua-Spa and the Hydro-Lux. Howie Jones, the owner and manager of the company, needs to decide how many of each type of hot tub to produce during his next production cycle. Howie buys prefabricated fiberglass hot tub shells from a local supplier and adds the pump and tubing to the shells to create his hot tubs. (This supplier has the capacity to deliver as many hot tub shells as Howie needs.) Howie installs the same type of pump into both hot tubs. He will have only 200 pumps available during his next production cycle. From a manufacturing standpoint, the main difference between the two models of hot tubs is the amount of tubing and labor required. Each Aqua-Spa requires 9 hours of labor and 12 feet of tubing. Each Hydro-Lux requires 6 hours of labor and 16 feet of tubing. Howie expects to have 1,566 production labor hours and 2,880 feet of tubing available during the next production cycle. Howie earns a profit of…arrow_forward
arrow_back_ios
SEE MORE QUESTIONS
arrow_forward_ios
Recommended textbooks for you
 Big Ideas Math A Bridge To Success Algebra 1: Stu...AlgebraISBN:9781680331141Author:HOUGHTON MIFFLIN HARCOURTPublisher:Houghton Mifflin Harcourt
 Glencoe Algebra 1, Student Edition, 9780079039897...AlgebraISBN:9780079039897Author:CarterPublisher:McGraw Hill
Big Ideas Math A Bridge To Success Algebra 1: Stu...
Algebra
ISBN:9781680331141
Author:HOUGHTON MIFFLIN HARCOURT
Publisher:Houghton Mifflin Harcourt
Glencoe Algebra 1, Student Edition, 9780079039897...
Algebra
ISBN:9780079039897
Author:Carter
Publisher:McGraw Hill
Statistics 4.1 Point Estimators; Author: Dr. Jack L. Jackson II;https://www.youtube.com/watch?v=2MrI0J8XCEE;License: Standard YouTube License, CC-BY
Statistics 101: Point Estimators; Author: Brandon Foltz;https://www.youtube.com/watch?v=4v41z3HwLaM;License: Standard YouTube License, CC-BY
Central limit theorem; Author: 365 Data Science;https://www.youtube.com/watch?v=b5xQmk9veZ4;License: Standard YouTube License, CC-BY
Point Estimate Definition & Example; Author: Prof. Essa;https://www.youtube.com/watch?v=OTVwtvQmSn0;License: Standard Youtube License
Point Estimation; Author: Vamsidhar Ambatipudi;https://www.youtube.com/watch?v=flqhlM2bZWc;License: Standard Youtube License