
Applied Statistics in Business and Economics
5th Edition
ISBN: 9780077837303
Author: David Doane, Lori Seward Senior Instructor of Operations Management
Publisher: McGraw-Hill Education
expand_more
expand_more
format_list_bulleted
Videos
Textbook Question
Chapter 17, Problem 49CE
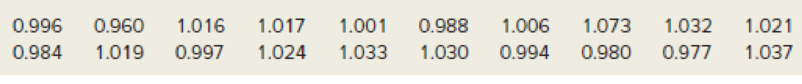
In painting an automobile at the factory, the thickness of the color coat has a process
Expert Solution & Answer
Want to see the full answer?
Check out a sample textbook solution
Students have asked these similar questions
iid
1. The CLT provides an approximate sampling distribution for the arithmetic average Ỹ of a
random sample Y₁, . . ., Yn f(y). The parameters of the approximate sampling distribution
depend on the mean and variance of the underlying random variables (i.e., the population
mean and variance). The approximation can be written to emphasize this, using the expec-
tation and variance of one of the random variables in the sample instead of the parameters
μ, 02:
YNEY,
· (1
(EY,, varyi
n
For the following population distributions f, write the approximate distribution of the sample
mean.
(a) Exponential with rate ẞ: f(y) = ß exp{−ßy}
1
(b) Chi-square with degrees of freedom: f(y) = ( 4 ) 2 y = exp { — ½/ }
г(
(c) Poisson with rate λ: P(Y = y) = exp(-\}
>
y!
y²
2. Let Y₁,……., Y be a random sample with common mean μ and common variance σ². Use the
CLT to write an expression approximating the CDF P(Ỹ ≤ x) in terms of µ, σ² and n, and
the standard normal CDF Fz(·).
math
Chapter 17 Solutions
Applied Statistics in Business and Economics
Ch. 17.1 - Define (a) productivity, (b) quality control, and...Ch. 17.1 - Explain the relationship between productivity and...Ch. 17.1 - Explain the difference between common cause...Ch. 17.1 - Prob. 4SECh. 17.1 - Explain the role of statisticians in quality...Ch. 17.2 - Prob. 6SECh. 17.2 - Prob. 7SECh. 17.3 - Prob. 8SECh. 17.3 - Prob. 9SECh. 17.3 - Identify three common quality improvement programs...
Ch. 17.3 - Why is the quality improvement process...Ch. 17.3 - Prob. 12SECh. 17.3 - Prob. 13SECh. 17.4 - Prob. 14SECh. 17.4 - Prob. 15SECh. 17.5 - (a) To construct control limits for an x chart,...Ch. 17.5 - Prob. 17SECh. 17.5 - List four rules for detecting abnormal (special...Ch. 17.5 - Set up control limits for an x chart, given x =...Ch. 17.5 - Prob. 20SECh. 17.5 - Prob. 21SECh. 17.5 - To print 8.5 5.5 note pads, a copy shop uses...Ch. 17.6 - Prob. 23SECh. 17.6 - Prob. 24SECh. 17.7 - Prob. 25SECh. 17.7 - Prob. 26SECh. 17.7 - Prob. 27SECh. 17.7 - Prob. 28SECh. 17.9 - Prob. 29SECh. 17.9 - Prob. 30SECh. 17.9 - Prob. 31SECh. 17 - Define (a) quality, (b) process, and (c)...Ch. 17 - Prob. 2CRCh. 17 - Prob. 3CRCh. 17 - Prob. 4CRCh. 17 - Prob. 5CRCh. 17 - Prob. 6CRCh. 17 - (a) Who was W. Edwards Deming and why is he...Ch. 17 - List three influential thinkers other than Deming...Ch. 17 - (a) Briefly explain each acronym: TQM, BPR, SQC,...Ch. 17 - (a) What is shown on the x chart? (b) Name three...Ch. 17 - Prob. 11CRCh. 17 - Prob. 12CRCh. 17 - Prob. 13CRCh. 17 - Prob. 14CRCh. 17 - Prob. 15CRCh. 17 - Briefly explain (a) the overadjustment problem,...Ch. 17 - Prob. 32CECh. 17 - Prob. 33CECh. 17 - Prob. 34CECh. 17 - Define three quality metrics that might be used to...Ch. 17 - Prob. 36CECh. 17 - Prob. 37CECh. 17 - Prob. 38CECh. 17 - Prob. 39CECh. 17 - Use your favorite Internet search engine to look...Ch. 17 - Make a fishbone chart (cause-and-effect diagram)...Ch. 17 - Make a fishbone chart (cause-and-effect diagram)...Ch. 17 - Make a fishbone chart (cause-and-effect diagram)...Ch. 17 - Prob. 44CECh. 17 - In painting an automobile, the thickness of the...Ch. 17 - Prob. 46CECh. 17 - Prob. 47CECh. 17 - Prob. 48CECh. 17 - In painting an automobile at the factory, the...Ch. 17 - Prob. 50CECh. 17 - Prob. 51CECh. 17 - Prob. 52CECh. 17 - Prob. 53CECh. 17 - A Nabisco Fig Newton has a process mean weight of...Ch. 17 - A new type of smoke detector battery is developed....Ch. 17 - Prob. 56CECh. 17 - Prob. 57CECh. 17 - Prob. 58CECh. 17 - Each gum drop in two bags of Sathers Gum Drops was...Ch. 17 - Prob. 60CECh. 17 - Prob. 61CECh. 17 - Prob. 62CECh. 17 - Prob. 63CECh. 17 - Refer to the bolt strength problem 17.47. Assuming...Ch. 17 - Refer to the paint problem 17.49 with =1.00 and ...
Knowledge Booster


Learn more about
Need a deep-dive on the concept behind this application? Look no further. Learn more about this topic, statistics and related others by exploring similar questions and additional content below.Similar questions
- Compute the median of the following data. 32, 41, 36, 42, 29, 30, 40, 22, 25, 37arrow_forwardTask Description: Read the following case study and answer the questions that follow. Ella is a 9-year-old third-grade student in an inclusive classroom. She has been diagnosed with Emotional and Behavioural Disorder (EBD). She has been struggling academically and socially due to challenges related to self-regulation, impulsivity, and emotional outbursts. Ella's behaviour includes frequent tantrums, defiance toward authority figures, and difficulty forming positive relationships with peers. Despite her challenges, Ella shows an interest in art and creative activities and demonstrates strong verbal skills when calm. Describe 2 strategies that could be implemented that could help Ella regulate her emotions in class (4 marks) Explain 2 strategies that could improve Ella’s social skills (4 marks) Identify 2 accommodations that could be implemented to support Ella academic progress and provide a rationale for your recommendation.(6 marks) Provide a detailed explanation of 2 ways…arrow_forwardQuestion 2: When John started his first job, his first end-of-year salary was $82,500. In the following years, he received salary raises as shown in the following table. Fill the Table: Fill the following table showing his end-of-year salary for each year. I have already provided the end-of-year salaries for the first three years. Calculate the end-of-year salaries for the remaining years using Excel. (If you Excel answer for the top 3 cells is not the same as the one in the following table, your formula / approach is incorrect) (2 points) Geometric Mean of Salary Raises: Calculate the geometric mean of the salary raises using the percentage figures provided in the second column named “% Raise”. (The geometric mean for this calculation should be nearly identical to the arithmetic mean. If your answer deviates significantly from the mean, it's likely incorrect. 2 points) Starting salary % Raise Raise Salary after raise 75000 10% 7500 82500 82500 4% 3300…arrow_forward
- I need help with this problem and an explanation of the solution for the image described below. (Statistics: Engineering Probabilities)arrow_forwardI need help with this problem and an explanation of the solution for the image described below. (Statistics: Engineering Probabilities)arrow_forward310015 K Question 9, 5.2.28-T Part 1 of 4 HW Score: 85.96%, 49 of 57 points Points: 1 Save of 6 Based on a poll, among adults who regret getting tattoos, 28% say that they were too young when they got their tattoos. Assume that six adults who regret getting tattoos are randomly selected, and find the indicated probability. Complete parts (a) through (d) below. a. Find the probability that none of the selected adults say that they were too young to get tattoos. 0.0520 (Round to four decimal places as needed.) Clear all Final check Feb 7 12:47 US Oarrow_forward
- how could the bar graph have been organized differently to make it easier to compare opinion changes within political partiesarrow_forwardDraw a picture of a normal distribution with mean 70 and standard deviation 5.arrow_forwardWhat do you guess are the standard deviations of the two distributions in the previous example problem?arrow_forward
- Please answer the questionsarrow_forward30. An individual who has automobile insurance from a certain company is randomly selected. Let Y be the num- ber of moving violations for which the individual was cited during the last 3 years. The pmf of Y isy | 1 2 4 8 16p(y) | .05 .10 .35 .40 .10 a.Compute E(Y).b. Suppose an individual with Y violations incurs a surcharge of $100Y^2. Calculate the expected amount of the surcharge.arrow_forward24. An insurance company offers its policyholders a num- ber of different premium payment options. For a ran- domly selected policyholder, let X = the number of months between successive payments. The cdf of X is as follows: F(x)=0.00 : x < 10.30 : 1≤x<30.40 : 3≤ x < 40.45 : 4≤ x <60.60 : 6≤ x < 121.00 : 12≤ x a. What is the pmf of X?b. Using just the cdf, compute P(3≤ X ≤6) and P(4≤ X).arrow_forward
arrow_back_ios
SEE MORE QUESTIONS
arrow_forward_ios
Recommended textbooks for you
 Glencoe Algebra 1, Student Edition, 9780079039897...AlgebraISBN:9780079039897Author:CarterPublisher:McGraw Hill
 Big Ideas Math A Bridge To Success Algebra 1: Stu...AlgebraISBN:9781680331141Author:HOUGHTON MIFFLIN HARCOURTPublisher:Houghton Mifflin Harcourt
 Holt Mcdougal Larson Pre-algebra: Student Edition...AlgebraISBN:9780547587776Author:HOLT MCDOUGALPublisher:HOLT MCDOUGAL
 College Algebra (MindTap Course List)AlgebraISBN:9781305652231Author:R. David Gustafson, Jeff HughesPublisher:Cengage Learning
Glencoe Algebra 1, Student Edition, 9780079039897...
Algebra
ISBN:9780079039897
Author:Carter
Publisher:McGraw Hill
Big Ideas Math A Bridge To Success Algebra 1: Stu...
Algebra
ISBN:9781680331141
Author:HOUGHTON MIFFLIN HARCOURT
Publisher:Houghton Mifflin Harcourt
Holt Mcdougal Larson Pre-algebra: Student Edition...
Algebra
ISBN:9780547587776
Author:HOLT MCDOUGAL
Publisher:HOLT MCDOUGAL
College Algebra (MindTap Course List)
Algebra
ISBN:9781305652231
Author:R. David Gustafson, Jeff Hughes
Publisher:Cengage Learning
F- Test or F- statistic (F- Test of Equality of Variance); Author: Prof. Arvind Kumar Sing;https://www.youtube.com/watch?v=PdUt7InTyc8;License: Standard Youtube License
Statistics 101: F-ratio Test for Two Equal Variances; Author: Brandon Foltz;https://www.youtube.com/watch?v=UWQO4gX7-lE;License: Standard YouTube License, CC-BY
Hypothesis Testing and Confidence Intervals (FRM Part 1 – Book 2 – Chapter 5); Author: Analystprep;https://www.youtube.com/watch?v=vth3yZIUlGQ;License: Standard YouTube License, CC-BY
Understanding the Levene's Test for Equality of Variances in SPSS; Author: Dr. Todd Grande;https://www.youtube.com/watch?v=udJr8V2P8Xo;License: Standard Youtube License