
Concept explainers
Videos
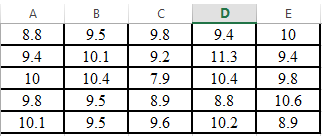
Given these data
| 8.8 | 9.5 | 9.8 | 9.4 | 10.0 |
| 9.4 | 10.1 | 9.2 | 11.3 | 9.4 |
| 10.0 | 10.4 | 7.9 | 10.4 | 9.8 |
| 9.8 | 9.5 | 8.9 | 8.8 | 10.6 |
| 10.1 | 9.5 | 9.6 | 10.2 | 8.9 |
Determine
(a) The Mean,
(b) The standard deviation,
(c) The Variance,
(d) The coefficient of variation, and
(e) The 95% confidence interval for the mean
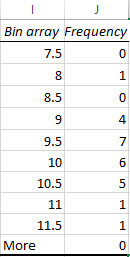
(f) Construct a histogram using a range from 7.5 to 11.5 with intervals of 0.5
(a)
To calculate: The mean of the given data.
| 8.8 | 9.5 | 9.8 | 9.4 | 10 |
| 9.4 | 10.1 | 9.2 | 11.3 | 9.4 |
| 10 | 10.4 | 7.9 | 10.4 | 9.8 |
| 9.8 | 9.5 | 8.9 | 8.8 | 10.6 |
| 10.1 | 9.5 | 9.6 | 10.2 | 8.9 |
Answer to Problem 1P
Solution:
The mean of the given data is
Explanation of Solution
Given Information:
The data is,
| 8.8 | 9.5 | 9.8 | 9.4 | 10 |
| 9.4 | 10.1 | 9.2 | 11.3 | 9.4 |
| 10 | 10.4 | 7.9 | 10.4 | 9.8 |
| 9.8 | 9.5 | 8.9 | 8.8 | 10.6 |
| 10.1 | 9.5 | 9.6 | 10.2 | 8.9 |
Calculation:
The mean of the data can be found out with the help of excel as shown below,
Step 1. First put the data in the excel as shown below,
Step 2. Use AVERAGE command in excel as shown below,
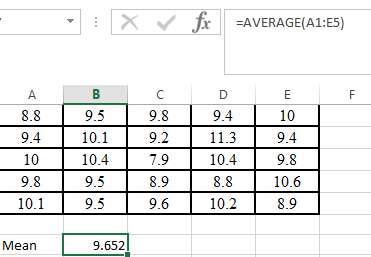
Hence, the mean of the given data is
(b)
To calculate: The standard deviation of the given data.
| 8.8 | 9.5 | 9.8 | 9.4 | 10 |
| 9.4 | 10.1 | 9.2 | 11.3 | 9.4 |
| 10 | 10.4 | 7.9 | 10.4 | 9.8 |
| 9.8 | 9.5 | 8.9 | 8.8 | 10.6 |
| 10.1 | 9.5 | 9.6 | 10.2 | 8.9 |
Answer to Problem 1P
Solution:
The standard deviation of the given data is
Explanation of Solution
Given Information:
The data is,
| 8.8 | 9.5 | 9.8 | 9.4 | 10 |
| 9.4 | 10.1 | 9.2 | 11.3 | 9.4 |
| 10 | 10.4 | 7.9 | 10.4 | 9.8 |
| 9.8 | 9.5 | 8.9 | 8.8 | 10.6 |
| 10.1 | 9.5 | 9.6 | 10.2 | 8.9 |
Calculation:
The standard deviation of the data can be found out with the help of excel as shown below,
Step 1. First put the data in the excel as shown below,
Step 2. Use STDEV command in excel as shown below,
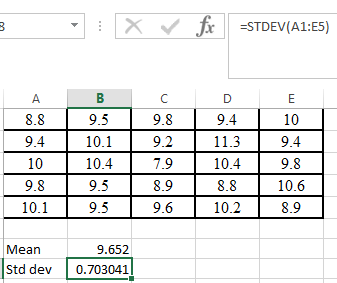
Hence, the standard deviation of the given data is
(c)
To calculate: The variance of the given data.
| 8.8 | 9.5 | 9.8 | 9.4 | 10 |
| 9.4 | 10.1 | 9.2 | 11.3 | 9.4 |
| 10 | 10.4 | 7.9 | 10.4 | 9.8 |
| 9.8 | 9.5 | 8.9 | 8.8 | 10.6 |
| 10.1 | 9.5 | 9.6 | 10.2 | 8.9 |
Answer to Problem 1P
Solution:
The variance of the given data is
Explanation of Solution
Given Information:
The data is,
| 8.8 | 9.5 | 9.8 | 9.4 | 10 |
| 9.4 | 10.1 | 9.2 | 11.3 | 9.4 |
| 10 | 10.4 | 7.9 | 10.4 | 9.8 |
| 9.8 | 9.5 | 8.9 | 8.8 | 10.6 |
| 10.1 | 9.5 | 9.6 | 10.2 | 8.9 |
Calculation:
The variance of the data can be found out with the help of excel as shown below,
Step 1. First put the data in the excel as shown below,
Step 2. Use VAR command in excel as shown below,
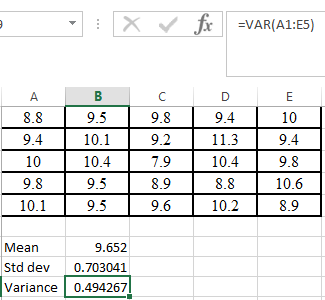
Hence, the variance of the given data is
(d)
To calculate: The coefficient of variation of the given data.
| 8.8 | 9.5 | 9.8 | 9.4 | 10 |
| 9.4 | 10.1 | 9.2 | 11.3 | 9.4 |
| 10 | 10.4 | 7.9 | 10.4 | 9.8 |
| 9.8 | 9.5 | 8.9 | 8.8 | 10.6 |
| 10.1 | 9.5 | 9.6 | 10.2 | 8.9 |
Answer to Problem 1P
Solution:
The coefficient of variation of the given data is
Explanation of Solution
Given Information:
The data is,
| 8.8 | 9.5 | 9.8 | 9.4 | 10 |
| 9.4 | 10.1 | 9.2 | 11.3 | 9.4 |
| 10 | 10.4 | 7.9 | 10.4 | 9.8 |
| 9.8 | 9.5 | 8.9 | 8.8 | 10.6 |
| 10.1 | 9.5 | 9.6 | 10.2 | 8.9 |
Formula used:
The coefficient of variation is
Calculation:
The coefficient of variation of the data can be found out with the help of excel as shown below,
Step 1. First put the data in the excel as shown below,
Step 2. Use coefficient of variation formula as shown below,
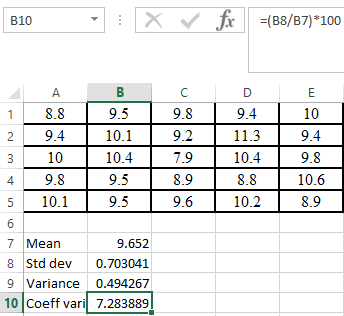
Hence, the coefficient of variation of the given data is
(e)
To calculate: The
| 8.8 | 9.5 | 9.8 | 9.4 | 10 |
| 9.4 | 10.1 | 9.2 | 11.3 | 9.4 |
| 10 | 10.4 | 7.9 | 10.4 | 9.8 |
| 9.8 | 9.5 | 8.9 | 8.8 | 10.6 |
| 10.1 | 9.5 | 9.6 | 10.2 | 8.9 |
Answer to Problem 1P
Solution:
The
Explanation of Solution
Given Information:
The data is,
| 8.8 | 9.5 | 9.8 | 9.4 | 10 |
| 9.4 | 10.1 | 9.2 | 11.3 | 9.4 |
| 10 | 10.4 | 7.9 | 10.4 | 9.8 |
| 9.8 | 9.5 | 8.9 | 8.8 | 10.6 |
| 10.1 | 9.5 | 9.6 | 10.2 | 8.9 |
Formula used:
The upper and lower range of
Where
Calculation:
Here,
The t calculator value for the given values is,
Use the formula to calculate the lower range,
And the upper range is,
Hence, the
(f)
To graph: The histogram of the given data by using a range from
| 8.8 | 9.5 | 9.8 | 9.4 | 10 |
| 9.4 | 10.1 | 9.2 | 11.3 | 9.4 |
| 10 | 10.4 | 7.9 | 10.4 | 9.8 |
| 9.8 | 9.5 | 8.9 | 8.8 | 10.6 |
| 10.1 | 9.5 | 9.6 | 10.2 | 8.9 |
Explanation of Solution
Given Information:
The data is,
| 8.8 | 9.5 | 9.8 | 9.4 | 10 |
| 9.4 | 10.1 | 9.2 | 11.3 | 9.4 |
| 10 | 10.4 | 7.9 | 10.4 | 9.8 |
| 9.8 | 9.5 | 8.9 | 8.8 | 10.6 |
| 10.1 | 9.5 | 9.6 | 10.2 | 8.9 |
Graph:
The histogram of the data can be found out with the help of excel as shown below,
Step 1. First put the data in the excel as shown below,
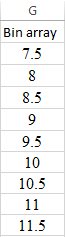
Step 2. Now insert the bin array range as shown below,
Step 3. Select on DATA, Data Analysis, Histogram and then OK.
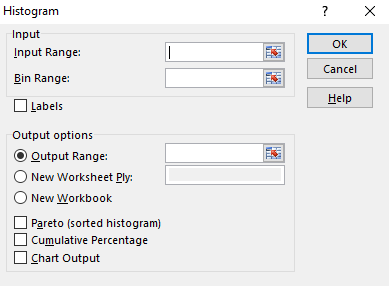
Step 4. Enter the input, Bin and output range as shown below,
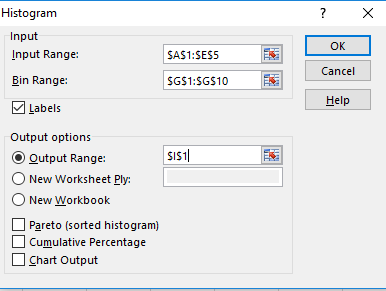
Step 5. The following result will appear.
Step 6. Now click on the insert and then column chart.
Interpretation:
It can be concluded from the histogram that 9.5 has repeated maximum time in the given data.
Want to see more full solutions like this?
Chapter 17 Solutions
Numerical Methods for Engineers


- Topic: Group Theory | Abstract Algebra Question: Let G be a finite group of order 45. Prove that G has a normal subgroup of order 5 or order 9, and describe the number of Sylow subgroups for each. Instructions: • Use Sylow's Theorems (existence, conjugacy, and counting). • List divisors of 45 and compute possibilities for n for p = 3 and p = 5. Show that if n = 1, the subgroup is normal. Conclude about group structure using your analysis.arrow_forwardTopic: Group Theory | Abstract Algebra Question: Let G be a finite group of order 45. Prove that G has a normal subgroup of order 5 or order 9, and describe the number of Sylow subgroups for each. Instructions: • Use Sylow's Theorems (existence, conjugacy, and counting). • List divisors of 45 and compute possibilities for n for p = 3 and p = 5. Show that if n = 1, the subgroup is normal. Conclude about group structure using your analysis.arrow_forwardTopic: Group Theory | Abstract Algebra Question: Let G be a finite group of order 45. Prove that G has a normal subgroup of order 5 or order 9, and describe the number of Sylow subgroups for each. Instructions: • Use Sylow's Theorems (existence, conjugacy, and counting). • List divisors of 45 and compute possibilities for n for p = 3 and p = 5. Show that if n = 1, the subgroup is normal. Conclude about group structure using your analysis.arrow_forward
- Complete solution requiredarrow_forwardTopic: Group Theory | Abstract Algebra Question: Let G be a finite group of order 45. Prove that G has a normal subgroup of order 5 or order 9, and describe the number of Sylow subgroups for each. Instructions: • Use Sylow's Theorems (existence, conjugacy, and counting). • List divisors of 45 and compute possibilities for n for p = 3 and p = 5. Show that if n = 1, the subgroup is normal. Conclude about group structure using your analysis.arrow_forwardTopic: Group Theory | Abstract Algebra Question: Let G be a finite group of order 45. Prove that G has a normal subgroup of order 5 or order 9, and describe the number of Sylow subgroups for each. Instructions: • Use Sylow's Theorems (existence, conjugacy, and counting). • List divisors of 45 and compute possibilities for n for p = 3 and p = 5. Show that if n = 1, the subgroup is normal. Conclude about group structure using your analysis.arrow_forward
- Do on pen and paper onlyarrow_forwardProblem 9: The 30-kg pipe is supported at A by a system of five cords. Determine the force in each cord for equilibrium. B 60º A E Harrow_forwardd((x, y), (z, w)) = |xz|+|yw|, show that whether d is a metric on R² or not?. Q3/Let R be a set of real number and d: R² x R² → R such that -> d((x, y), (z, w)) = max{\x - zl, ly - w} show that whether d is a metric on R² or not?. Q4/Let X be a nonempty set and d₁, d₂: XXR are metrics on X let d3,d4, d5: XX → R such that d3(x, y) = 4d2(x, y) d4(x, y) = 3d₁(x, y) +2d2(x, y) d5(x,y) = 2d₁ (x,y))/ 1+ 2d₂(x, y). Show that whether d3, d4 and d5 are metric on X or not?arrow_forward
 Glencoe Algebra 1, Student Edition, 9780079039897...AlgebraISBN:9780079039897Author:CarterPublisher:McGraw Hill
 Big Ideas Math A Bridge To Success Algebra 1: Stu...AlgebraISBN:9781680331141Author:HOUGHTON MIFFLIN HARCOURTPublisher:Houghton Mifflin Harcourt