
Videos
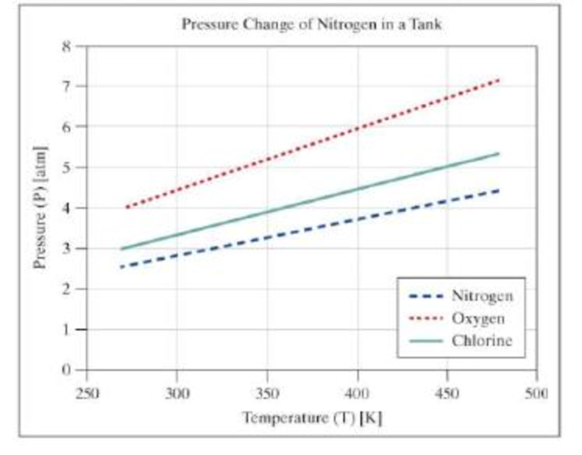
You want to create a graph showing the relationship of an ideal gas between pressure (P) and temperature (T). Allow the initial temperature to be 270 kelvin. The range of temperatures to be modeled ranges from 270 to 480 kelvin. Control the scale of the abscissa so the range is shown from 250 to 500 kelvin.
Model two gases:
- Nitrogen (formula, N2; molecular weight, 28 grams per mole), using a 12-liter tank with an initial pressure of 2.5 atmospheres.
- Oxygen (formula, O2; molecular weight, 32 grams per mole), using a 15-liter tank with an initial pressure of 4 atmospheres.
After drawing the graph for nitrogen and oxygen, model a third gas, with information entered by the user. Assume the volume is 12 liters.
Ask the user to enter the name of the gas [Example: Chlorine]
Ask the user to enter the initial pressure in the tank measured at 270 kelvin [Example: 3 atm]
Ask the user to enter the temperature of interest [Example: 400 kelvin]. The user is interested in a temperature in the range of 270 to 480 kelvin.
Output the following information to the Command Window:
At a temperature of TTT kelvin for GGG, the pressure is P.P atm.
where:
- TTT is the temperature of interest entered by the user;
- GGG is the name of the gas; and
- P.P is the pressure at that temperature shown to one decimal place.
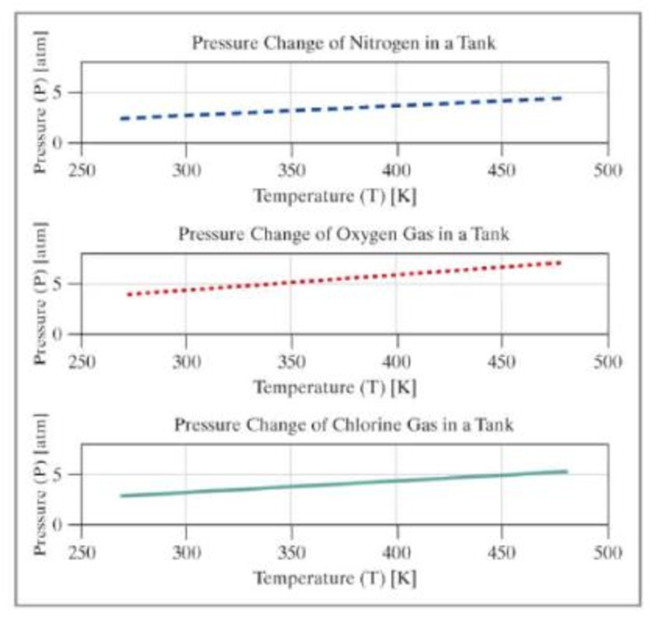
Add the user-entered gas to the graph, showing the pressure over the range of temperatures from 270 to 480 kelvin. In addition to the single graph with three data series, create an additional figure window with a set of subplots showing each data series as an individual subplot.
Your output should be similar to the following:
In the Command Window:
Enter the name of the gas: Chlorine
Enter the initial pressure [atm] : 3
Enter the temp of interest [K]: 400
At a temperature of 400 kelvin, chlorine has a pressure of 4.4 atm.
The figures should appear similar to the following. The colors and line types may vary.
Want to see the full answer?
Check out a sample textbook solution
Chapter 17 Solutions
THINKING LIKE AN ENGINEER W/ACCESS


- Calculate the Moment About the Point A -20"- 5 lb 40 N D 1.5 m 40 N 4.5 m A 15 lb. 150 mm 52 N 5 12 100 mm 15 lb. 26 lb. 12 5 34 lb. 13 8 15 77777 36 lb.arrow_forwardFormala for Hunzontal component= + cos & Vertical Component: Fsin t Find the vertical and horizontal components for the figure bellow: 30° 200 N 77 200 cos 30 = 173 N // 200 sin 30 = 100 N YA a₂+b₂ b₂ (b₁,b₂) a+b 20haits (a+b₁,a+b) Magnitude a and b a = lbl = 2o unite rugle of vector a wt Horisontal Axis = 30 11 vector & wt Honzontal Axis - 60° b b a= |a| Cas 30 a2 (a1, a2) ag = 10 bx = /b/ cos a 1 20 cos 80 = 17.32 Sia 30 = 20 sin 30. 60 = 10 = 20 Cos 60 = It by = 161 sin 60 = 20 sia 60 = 17.32 b₁ Rx ax +bx = 17.32 +10=2732 a₁ a₁+b₁ X By = ou + by= + + by = 10 + 17.32 =27.32 Magnitude = 38.637 Find the Vector a +b the Resultans The angle of the vector with the horizontal axle is 30 degrees while the angle of the vector b is 60 degrees. The magnitude of both vectors is 20 (units) angle of the Resultant vector = tam- " (14) 45arrow_forwardThe net force exerted on the piston by the exploding fuel-air mixture and friction is 5 kN to the left. A clockwise couple M = 200 N-m acts on the crank AB. The moment of inertia of the crank about A is 0.0003 kg-m2 . The mass of the connecting rod BC is 0.36 kg, and its center of mass is 40 mm from B on the line from B to C. The connecting rod’s moment of inertia about its center of mass is 0.0004 kg-m2 . The mass of the piston is 4.6 kg. The crank AB has a counterclockwise angular velocity of 2000 rpm at the instant shown. Neglect the gravitational forces on the crank, connecting rod, and piston – they still have mass, just don’t include weight on the FBDs. What is the piston’s acceleration?arrow_forward
- Solve only no 1 calculations,the one with diagram,I need handwritten expert solutionsarrow_forwardProblem 3 • Compute the coefficient matrix and the right-hand side of the n-parameter Ritz approximation of the equation d du (1+x)· = 0 for 0 < x < 1 dx dx u (0) = 0, u(1) = 1 Use algebraic polynomials for the approximation functions. Specialize your result for n = 2 and compute the Ritz coefficients.arrow_forwardFinite Element Analysis. Solve step by steparrow_forward
- Draw the top view In autoCAD from graphicsarrow_forwardAnswer all the calculations questions, if you are not not expert please don't attempt, don't use artificial intelligencearrow_forwardPlease measure the size of the following object, and then draw the front, top and side view in the AutoCAD (including the printing) just one arrow for this one 30arrow_forward
 Elements Of ElectromagneticsMechanical EngineeringISBN:9780190698614Author:Sadiku, Matthew N. O.Publisher:Oxford University Press
 Mechanics of Materials (10th Edition)Mechanical EngineeringISBN:9780134319650Author:Russell C. HibbelerPublisher:PEARSON
 Thermodynamics: An Engineering ApproachMechanical EngineeringISBN:9781259822674Author:Yunus A. Cengel Dr., Michael A. BolesPublisher:McGraw-Hill Education
 Control Systems EngineeringMechanical EngineeringISBN:9781118170519Author:Norman S. NisePublisher:WILEY
 Mechanics of Materials (MindTap Course List)Mechanical EngineeringISBN:9781337093347Author:Barry J. Goodno, James M. GerePublisher:Cengage Learning
 Engineering Mechanics: StaticsMechanical EngineeringISBN:9781118807330Author:James L. Meriam, L. G. Kraige, J. N. BoltonPublisher:WILEY