
Modern Business Statistics with Microsoft Office Excel (with XLSTAT Education Edition Printed Access Card)
6th Edition
ISBN: 9780357228708
Author: David R. Anderson; Dennis J. Sweeney; Thomas A. Williams
Publisher: Cengage Learning US
expand_more
expand_more
format_list_bulleted
Concept explainers
Videos
Textbook Question
Chapter 16.6, Problem 25E
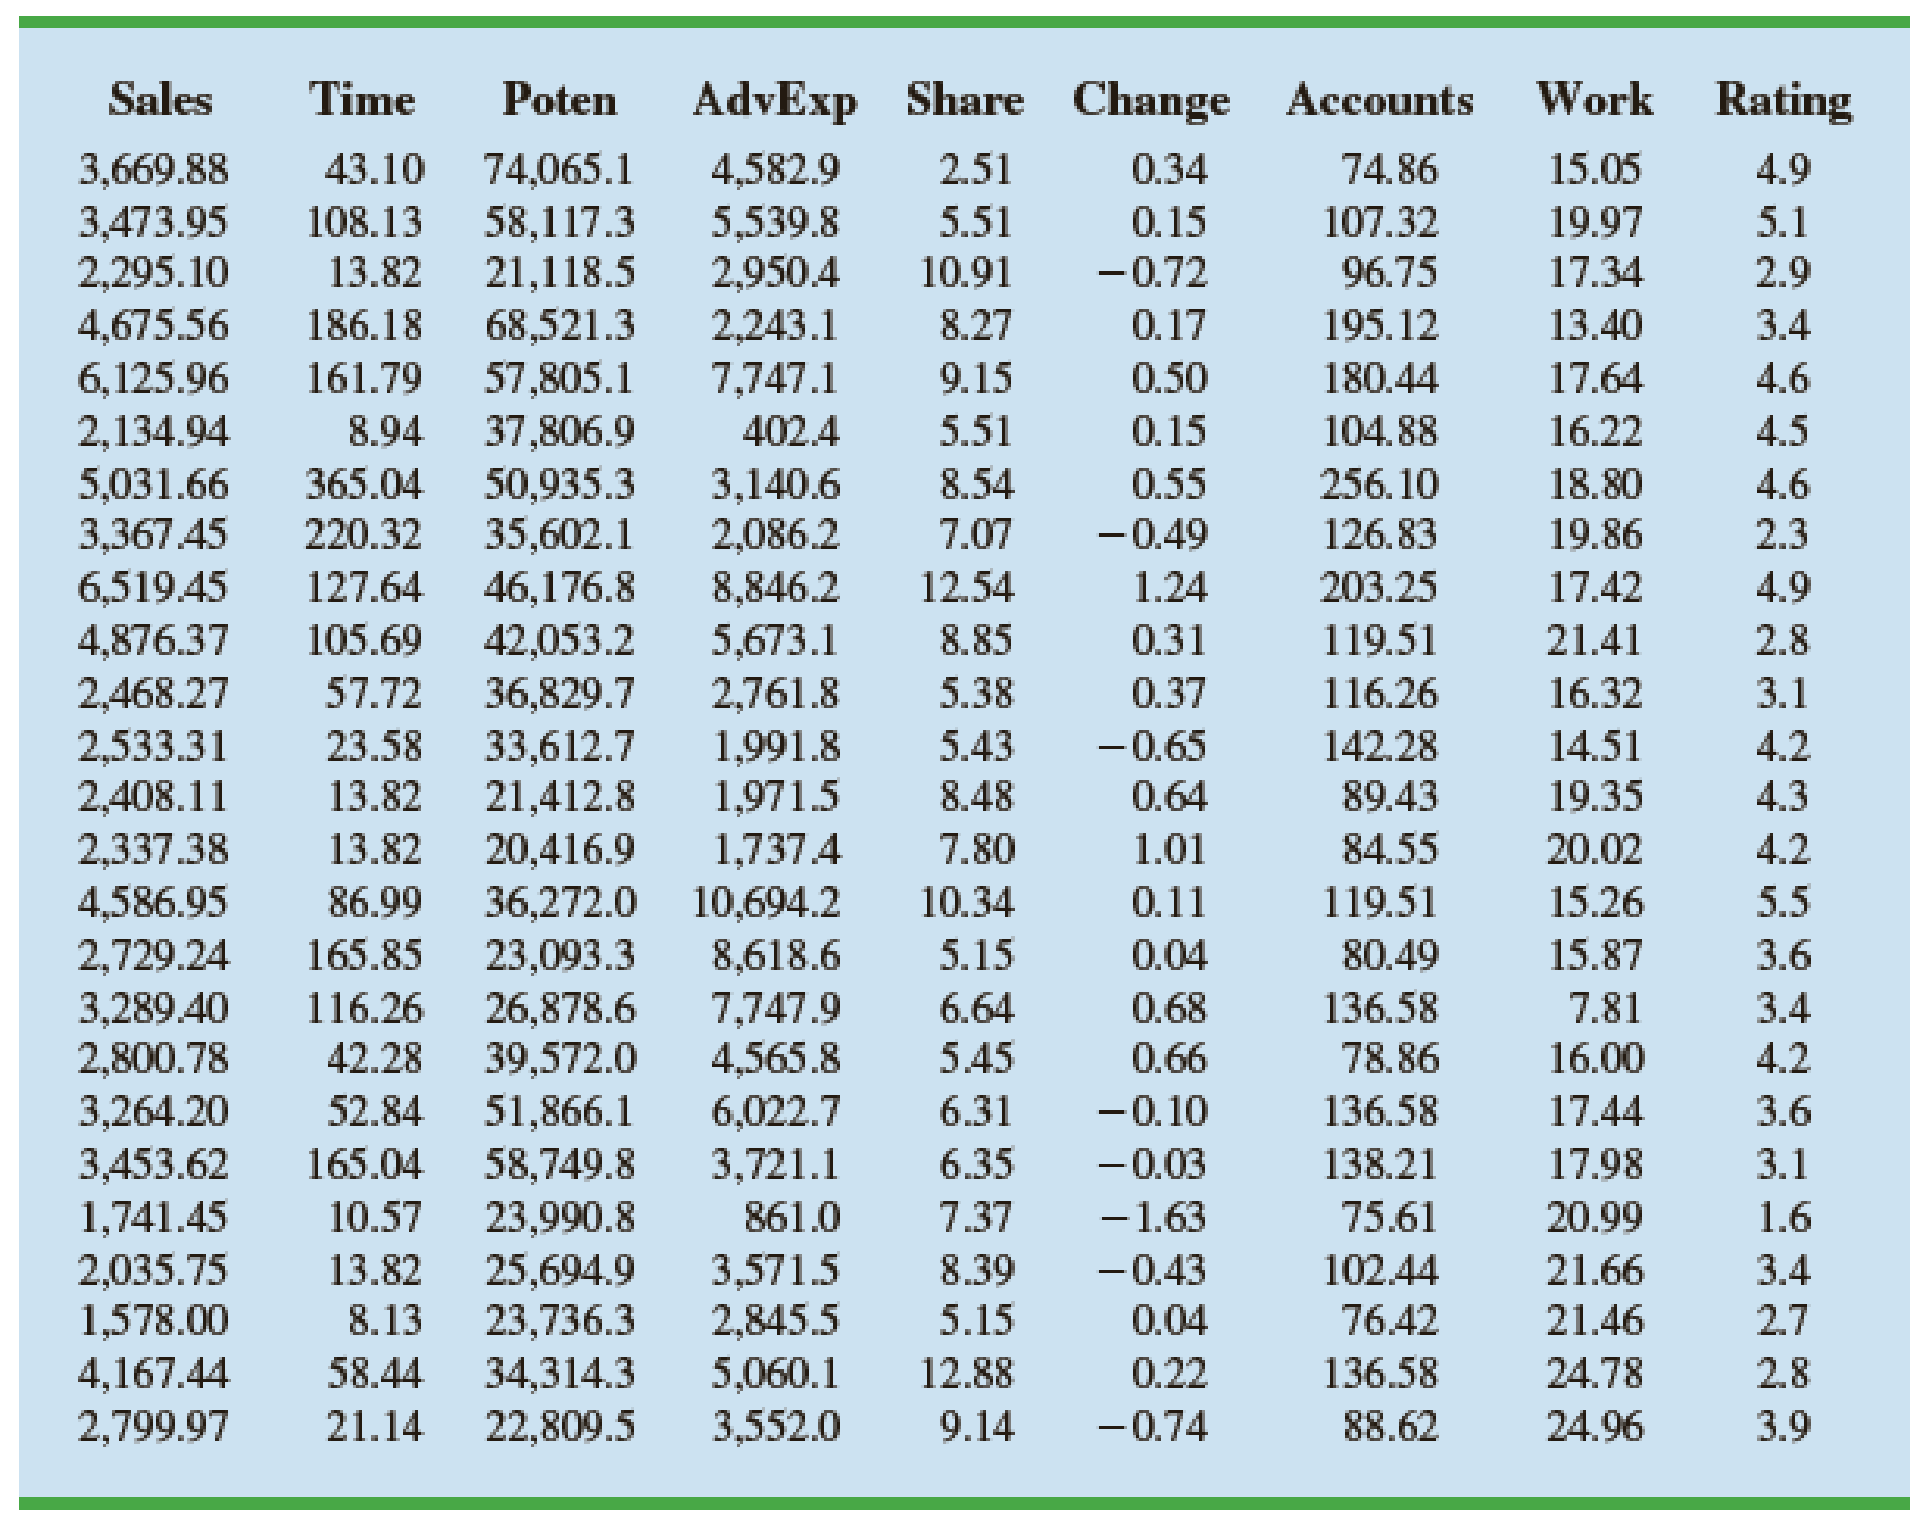
Refer to the Cravens data set in Table 16.5. In Section 16.3 we showed that the estimated regression equation involving Accounts, AdvExp, Poten, and Share had an adjusted coefficient of determination of 88.1%. Use the .05 level of significance and apply the Durbin–Watson test to determine whether positive autocorrelation is present.
TABLE 16.5 THE CRAVENS DATA
Expert Solution & Answer
Want to see the full answer?
Check out a sample textbook solution
Students have asked these similar questions
A 24-1 design has been used to investigate the effect of four factors on the resistivity of a silicon wafer. The data
from this experiment are shown in Table 4.
Table 4: Resistivity Experiment for Exercise 5
Run
A
B
с
D
Resistivity
1
23
2
3
4
5
6
7
8
9
10
11
12
I+I+I+I+Oooo
0
0
||++TI++o000
33.2
4.6
31.2
9.6
40.6
162.4
39.4
158.6
63.4
62.6
58.7
0
0
60.9
3
(a) Estimate the factor effects. Plot the effect estimates on a normal probability scale.
(b) Identify a tentative model for this process. Fit the model and test for curvature.
(c) Plot the residuals from the model in part (b) versus the predicted resistivity. Is there any indication on
this plot of model inadequacy?
(d) Construct a normal probability plot of the residuals. Is there any reason to doubt the validity of the
normality assumption?
Stem1: 1,4
Stem 2: 2,4,8
Stem3: 2,4
Stem4: 0,1,6,8
Stem5: 0,1,2,3,9
Stem 6: 2,2
What’s the Min,Q1, Med,Q3,Max?
Are the t-statistics here greater than 1.96? What do you conclude?
colgPA= 1.39+0.412 hsGPA
(.33) (0.094)
Find the P value
Chapter 16 Solutions
Modern Business Statistics with Microsoft Office Excel (with XLSTAT Education Edition Printed Access Card)
Ch. 16.1 - Consider the following data for two variables, x...Ch. 16.1 - Consider the following data for two variables, x...Ch. 16.1 - Prob. 3ECh. 16.1 - A highway department is studying the relationship...Ch. 16.1 - In working further with the problem of exercise 4,...Ch. 16.1 - A study of emergency service facilities...Ch. 16.1 - Home Depot, a nationwide home improvement...Ch. 16.1 - Corvette, Ferrari, and Jaguar produced a variety...Ch. 16.1 - The film Suicide Squad has an average rating of...Ch. 16.2 - In a regression analysis involving 27...
Ch. 16.2 - Prob. 11ECh. 16.2 - The Professional Golfers’ Association of America...Ch. 16.2 - Refer to exercise 12.
Develop an estimated...Ch. 16.2 - A 10-year study conducted by the American Heart...Ch. 16.2 - The average monthly residential gas bill for Black...Ch. 16.5 - Prob. 16ECh. 16.5 - Prob. 17ECh. 16.5 - Prob. 18ECh. 16.5 - Prob. 19ECh. 16.5 - Prob. 20ECh. 16.5 - Prob. 21ECh. 16.5 - Prob. 22ECh. 16.5 - Prob. 23ECh. 16.6 - The following data show the daily closing prices...Ch. 16.6 - Refer to the Cravens data set in Table 16.5. In...Ch. 16 - A sample containing years to maturity and yield...Ch. 16 - Consumer Reports tested 19 different brands and...Ch. 16 - A study investigated the relationship between...Ch. 16 - Refer to the data in exercise 28. Consider a model...Ch. 16 - Refer to the data in exercise 28.
Develop an...Ch. 16 - Prob. 31SECh. 16 - The Ladies Professional Golf Association (LPGA)...Ch. 16 - Wine Spectator magazine contains articles and...
Knowledge Booster


Learn more about
Need a deep-dive on the concept behind this application? Look no further. Learn more about this topic, statistics and related others by exploring similar questions and additional content below.Similar questions
- A poll before the elections showed that in a given sample 79% of people vote for candidate C. How many people should be interviewed so that the pollsters can be 99% sure that from 75% to 83% of the population will vote for candidate C? Round your answer to the whole number.arrow_forwardSuppose a random sample of 459 married couples found that 307 had two or more personality preferences in common. In another random sample of 471 married couples, it was found that only 31 had no preferences in common. Let p1 be the population proportion of all married couples who have two or more personality preferences in common. Let p2 be the population proportion of all married couples who have no personality preferences in common. Find a95% confidence interval for . Round your answer to three decimal places.arrow_forwardA history teacher interviewed a random sample of 80 students about their preferences in learning activities outside of school and whether they are considering watching a historical movie at the cinema. 69 answered that they would like to go to the cinema. Let p represent the proportion of students who want to watch a historical movie. Determine the maximal margin of error. Use α = 0.05. Round your answer to three decimal places. arrow_forward
- A random sample of medical files is used to estimate the proportion p of all people who have blood type B. If you have no preliminary estimate for p, how many medical files should you include in a random sample in order to be 99% sure that the point estimate will be within a distance of 0.07 from p? Round your answer to the next higher whole number.arrow_forwardA clinical study is designed to assess the average length of hospital stay of patients who underwent surgery. A preliminary study of a random sample of 70 surgery patients’ records showed that the standard deviation of the lengths of stay of all surgery patients is 7.5 days. How large should a sample to estimate the desired mean to within 1 day at 95% confidence? Round your answer to the whole number.arrow_forwardA clinical study is designed to assess the average length of hospital stay of patients who underwent surgery. A preliminary study of a random sample of 70 surgery patients’ records showed that the standard deviation of the lengths of stay of all surgery patients is 7.5 days. How large should a sample to estimate the desired mean to within 1 day at 95% confidence? Round your answer to the whole number.arrow_forward
- In the experiment a sample of subjects is drawn of people who have an elbow surgery. Each of the people included in the sample was interviewed about their health status and measurements were taken before and after surgery. Are the measurements before and after the operation independent or dependent samples?arrow_forwardiid 1. The CLT provides an approximate sampling distribution for the arithmetic average Ỹ of a random sample Y₁, . . ., Yn f(y). The parameters of the approximate sampling distribution depend on the mean and variance of the underlying random variables (i.e., the population mean and variance). The approximation can be written to emphasize this, using the expec- tation and variance of one of the random variables in the sample instead of the parameters μ, 02: YNEY, · (1 (EY,, varyi n For the following population distributions f, write the approximate distribution of the sample mean. (a) Exponential with rate ẞ: f(y) = ß exp{−ßy} 1 (b) Chi-square with degrees of freedom: f(y) = ( 4 ) 2 y = exp { — ½/ } г( (c) Poisson with rate λ: P(Y = y) = exp(-\} > y! y²arrow_forward2. Let Y₁,……., Y be a random sample with common mean μ and common variance σ². Use the CLT to write an expression approximating the CDF P(Ỹ ≤ x) in terms of µ, σ² and n, and the standard normal CDF Fz(·).arrow_forward
- matharrow_forwardCompute the median of the following data. 32, 41, 36, 42, 29, 30, 40, 22, 25, 37arrow_forwardTask Description: Read the following case study and answer the questions that follow. Ella is a 9-year-old third-grade student in an inclusive classroom. She has been diagnosed with Emotional and Behavioural Disorder (EBD). She has been struggling academically and socially due to challenges related to self-regulation, impulsivity, and emotional outbursts. Ella's behaviour includes frequent tantrums, defiance toward authority figures, and difficulty forming positive relationships with peers. Despite her challenges, Ella shows an interest in art and creative activities and demonstrates strong verbal skills when calm. Describe 2 strategies that could be implemented that could help Ella regulate her emotions in class (4 marks) Explain 2 strategies that could improve Ella’s social skills (4 marks) Identify 2 accommodations that could be implemented to support Ella academic progress and provide a rationale for your recommendation.(6 marks) Provide a detailed explanation of 2 ways…arrow_forward
arrow_back_ios
SEE MORE QUESTIONS
arrow_forward_ios
Recommended textbooks for you
 Glencoe Algebra 1, Student Edition, 9780079039897...AlgebraISBN:9780079039897Author:CarterPublisher:McGraw Hill
 Big Ideas Math A Bridge To Success Algebra 1: Stu...AlgebraISBN:9781680331141Author:HOUGHTON MIFFLIN HARCOURTPublisher:Houghton Mifflin Harcourt
 Functions and Change: A Modeling Approach to Coll...AlgebraISBN:9781337111348Author:Bruce Crauder, Benny Evans, Alan NoellPublisher:Cengage Learning
 Holt Mcdougal Larson Pre-algebra: Student Edition...AlgebraISBN:9780547587776Author:HOLT MCDOUGALPublisher:HOLT MCDOUGAL
 College AlgebraAlgebraISBN:9781305115545Author:James Stewart, Lothar Redlin, Saleem WatsonPublisher:Cengage Learning
Glencoe Algebra 1, Student Edition, 9780079039897...
Algebra
ISBN:9780079039897
Author:Carter
Publisher:McGraw Hill
Big Ideas Math A Bridge To Success Algebra 1: Stu...
Algebra
ISBN:9781680331141
Author:HOUGHTON MIFFLIN HARCOURT
Publisher:Houghton Mifflin Harcourt
Functions and Change: A Modeling Approach to Coll...
Algebra
ISBN:9781337111348
Author:Bruce Crauder, Benny Evans, Alan Noell
Publisher:Cengage Learning
Holt Mcdougal Larson Pre-algebra: Student Edition...
Algebra
ISBN:9780547587776
Author:HOLT MCDOUGAL
Publisher:HOLT MCDOUGAL
College Algebra
Algebra
ISBN:9781305115545
Author:James Stewart, Lothar Redlin, Saleem Watson
Publisher:Cengage Learning
The Shape of Data: Distributions: Crash Course Statistics #7; Author: CrashCourse;https://www.youtube.com/watch?v=bPFNxD3Yg6U;License: Standard YouTube License, CC-BY
Shape, Center, and Spread - Module 20.2 (Part 1); Author: Mrmathblog;https://www.youtube.com/watch?v=COaid7O_Gag;License: Standard YouTube License, CC-BY
Shape, Center and Spread; Author: Emily Murdock;https://www.youtube.com/watch?v=_YyW0DSCzpM;License: Standard Youtube License