(a)
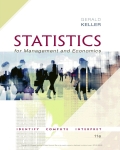
Draw the scatter diagram that shows the relationship between television and overweight.
(a)
Explanation of Solution
Figure 1 shows the scatter diagram of television and overweight.
In the above figure, the vertical axis measures overweight and the horizontal axis measures television. The position of the scatters shows a positive relationship between overweight and television.
Scatter diagram: The scatter diagram shows the value of two variables plotted along two axes. Each scatter represents the relationship between the variables.
(b)
Calculate the least squares line and interpret the slope of the line.
(b)
Explanation of Solution
The least squares regression line is shown below:
Where b0 is the y-intercept and b1 is the slope of the regression line.
The least squares regression line is calculated as follows:
Table 1
| Xi | Yi | Xi2 | Yi2 | XiYI | |
| 1 | 42 | 18 | 1,764 | 324 | 756 |
| 2 | 34 | 6 | 1,156 | 36 | 204 |
| 3 | 25 | 0 | 625 | 0 | 0 |
| 4 | 35 | –1 | 1,225 | 1 | –35 |
| 5 | 37 | 13 | 1,369 | 169 | 481 |
| 6 | 38 | 14 | 1,444 | 196 | 532 |
| 7 | 31 | 7 | 961 | 49 | 217 |
| 8 | 33 | 7 | 1,089 | 49 | 231 |
| 9 | 19 | –9 | 361 | 81 | –171 |
| 10 | 29 | 8 | 841 | 64 | 232 |
| 11 | 38 | 8 | 1,444 | 64 | 304 |
| 12 | 28 | 5 | 784 | 25 | 140 |
| 13 | 29 | 3 | 841 | 9 | 87 |
| 14 | 36 | 14 | 1,296 | 196 | 504 |
| 15 | 18 | –7 | 324 | 49 | –126 |
| Total | 472 | 86 | 15,524 | 1,312 | 3,356 |
These table values are obtained using a spreadsheet.
The least square line shows that weight increases on average by 0.9675 pounds for each additional hours of television.
Want to see more full solutions like this?
Chapter 16 Solutions
EBK STATISTICS FOR MANAGEMENT AND ECONO

- not use ai please don't kdjdkdkfjnxncjcarrow_forwardAsk one question at a time. Keep questions specific and include all details. Need more help? Subject matter experts with PhDs and Masters are standing by 24/7 to answer your question.**arrow_forward1b. (5 pts) Under the 1990 Farm Bill and given the initial situation of a target price and marketing loan, indicate where the market price (MP), quantity supplied (QS) and demanded (QD), government stocks (GS), and Deficiency Payments (DP) and Marketing Loan Gains (MLG), if any, would be on the graph below. If applicable, indicate the price floor (PF) on the graph. TP $ NLR So Do Q/yrarrow_forward
- Now, let us assume that Brie has altruistic preferences. Her utility function is now given by: 1 UB (xA, YA, TB,YB) = (1/2) (2x+2y) + (2x+2y) What would her utility be at the endowment now? (Round off your answer to the nearest whole number.) 110arrow_forwardProblema 4 (20 puntos): Supongamos que tenemos un ingreso de $120 y enfrentamos los precios P₁ =6 y P₂ =4. Nuestra función de utilidad es: U(x1, x2) = x0.4x0.6 a) Planteen el problema de optimización y obtengan las condiciones de primer orden. b) Encuentren el consumo óptimo de x1 y x2. c) ¿Cómo cambiará nuestra elección óptima si el ingreso aumenta a $180?arrow_forwardPlease draw the graph for number 4 and 5, I appreciate it!!arrow_forward
- not use ai pleasearrow_forwardnot use ai pleasearrow_forward• Prismatic Cards: A prismatic card will be a card that counts as having every suit. We will denote, e.g., a prismatic Queen card by Q*. With this notation, 2.3045 Q would be a double flush since every card is a diamond and a heart. • Wild Cards: A wild card counts as having every suit and every denomination. Denote wild cards with a W; if there are multiple, we will denote them W₁, W2, etc. With this notation, W2 20.30054 would be both a three-of-a-kind (three 2's) and a flush (5 diamonds). If we add multiple wild cards to the deck, they count as distinct cards, so that (e.g.) the following two hands count as "different hands" when counting: W15 5Q and W255◊♡♡♣♣ In addition, 1. Let's start with the unmodified double-suited deck. (a) Call a hand a flush house if it is a flush and a full house, i.e. if all cards share a suit and there are 3 cards of one denomination and two of another. For example, 550. house. How many different flush house hands are there? 2. Suppose we add one wild…arrow_forward
- not use ai pleasearrow_forwardIn a classic oil-drilling example, you are trying to decide whether to drill for oil on a field that might or might not contain any oil. Before making this decision, you have the option of hiring a geologist to perform some seismic tests and then predict whether there is any oil or not. You assess that if there is actually oil, the geologist will predict there is oil with probability 0.85 . You also assess that if there is no oil, the geologist will predict there is no oil with probability 0.90. Please answer the two questions below, as I am trying to ensure that I am correct. 1. Why will these two probabilities not appear on the decision tree? 2. Which probabilities will be on the decision tree?arrow_forwardAsap pleasearrow_forward


 Principles of Economics 2eEconomicsISBN:9781947172364Author:Steven A. Greenlaw; David ShapiroPublisher:OpenStax