
Videos
1(a)
Determine return on total assets for five years (20Y4 to 20Y8).
1(a)
Explanation of Solution
Financial Ratios: Financial ratios are the metrics used to evaluate the liquidity, capabilities, profitability, and overall performance of a company.
Return on assets determines the particular company’s overall earning power. It is determined by dividing sum of net income and interest expense and average total assets.
Formula:
1(b)
Determine return on
1(b)
Explanation of Solution
Formula:
1(c)
Determine times interest earned ratio for five years.
1(c)
Explanation of Solution
Times interest earned ratio quantifies the number of times the earnings before interest and taxes can pay the interest expense. First, determine the sum of income before income tax and interest expense. Then, divide the sum by interest expense.
Formula:
1(d)
Determine ratio of liabilities to stockholders’ equity for five years (20Y4 to 20Y8).
1(d)
Explanation of Solution
Ratio of liabilities to stockholders’ equity is determined by dividing liabilities and stockholders’ equity. Liabilities are determined as the difference between ending balance of assets and stockholders’ equity.
Formula:
Display the determined ratios in a graph.
Explanation of Solution
Return on total assets
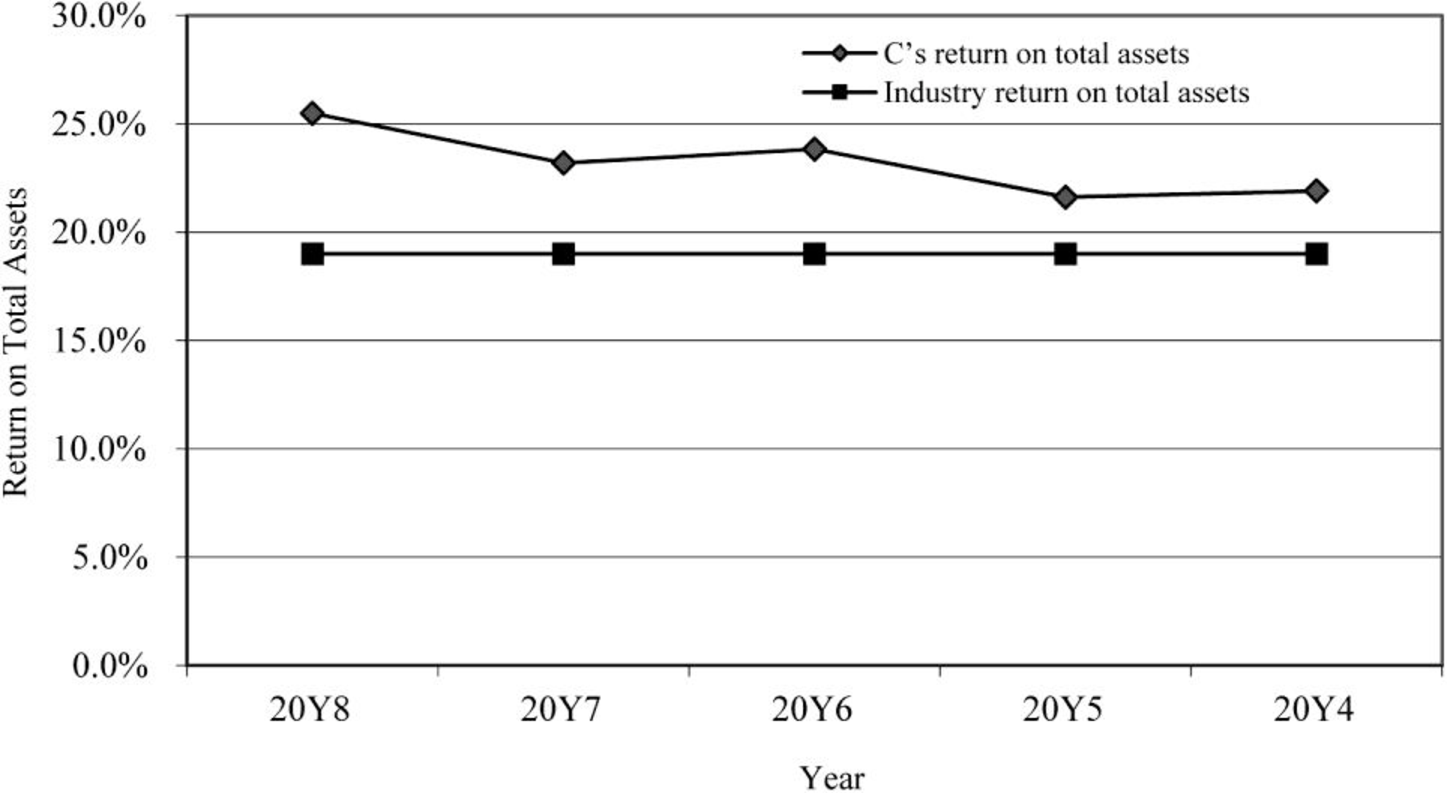
Figure (1)
Return on stockholders’ equity
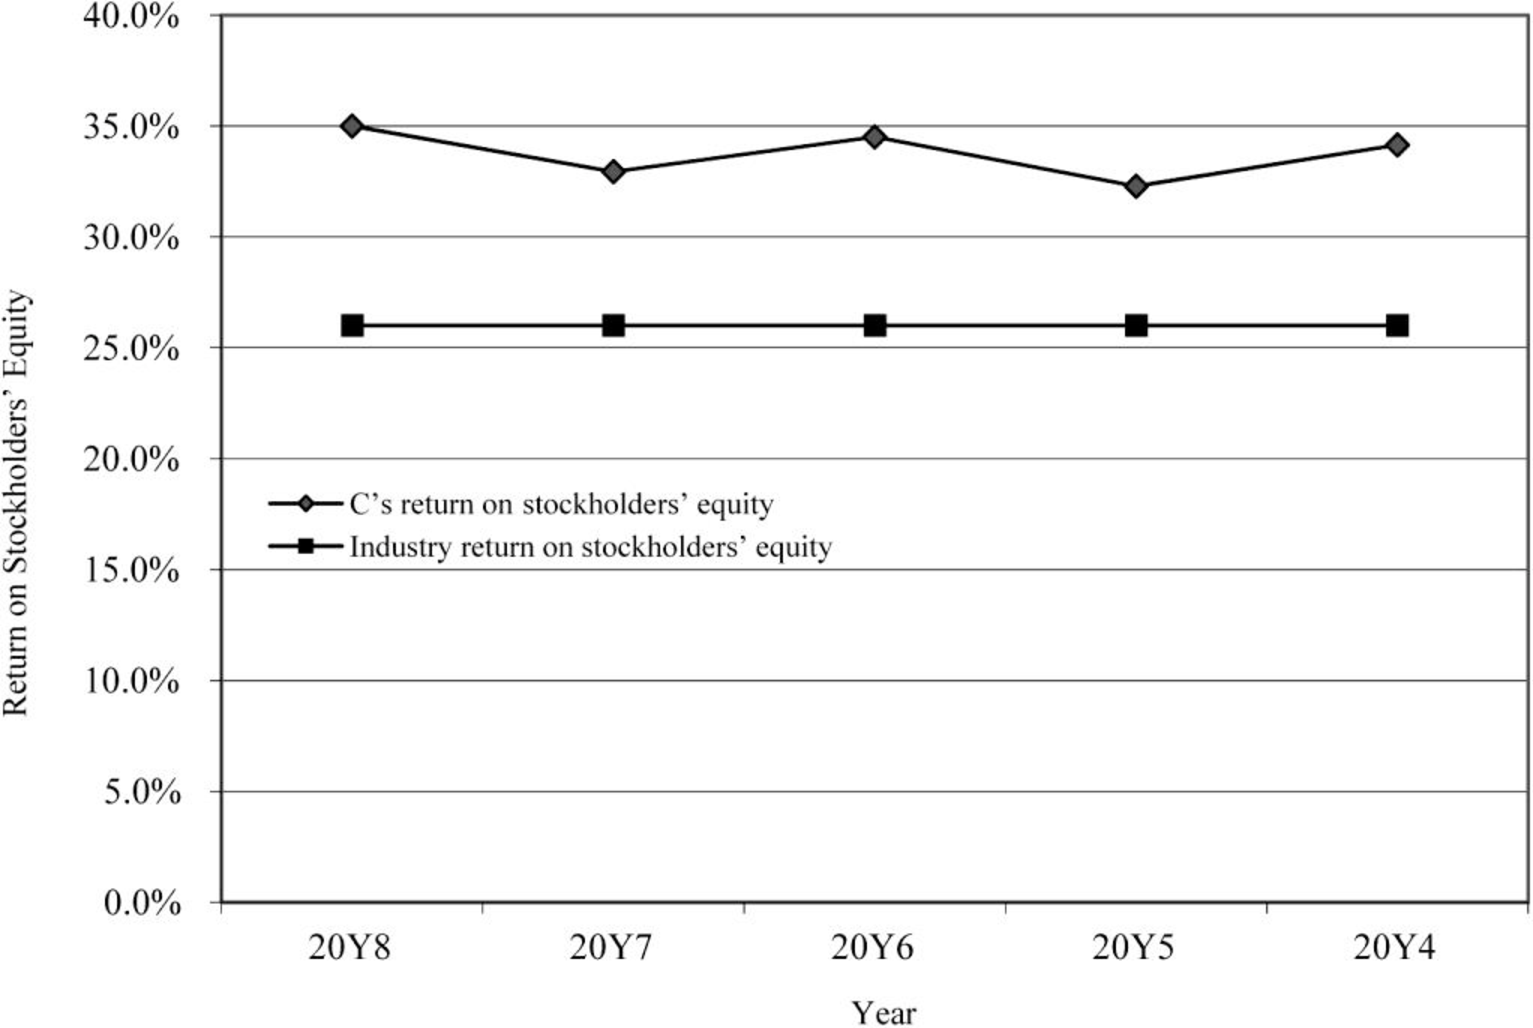
Figure (2)
Times interest earned ratio
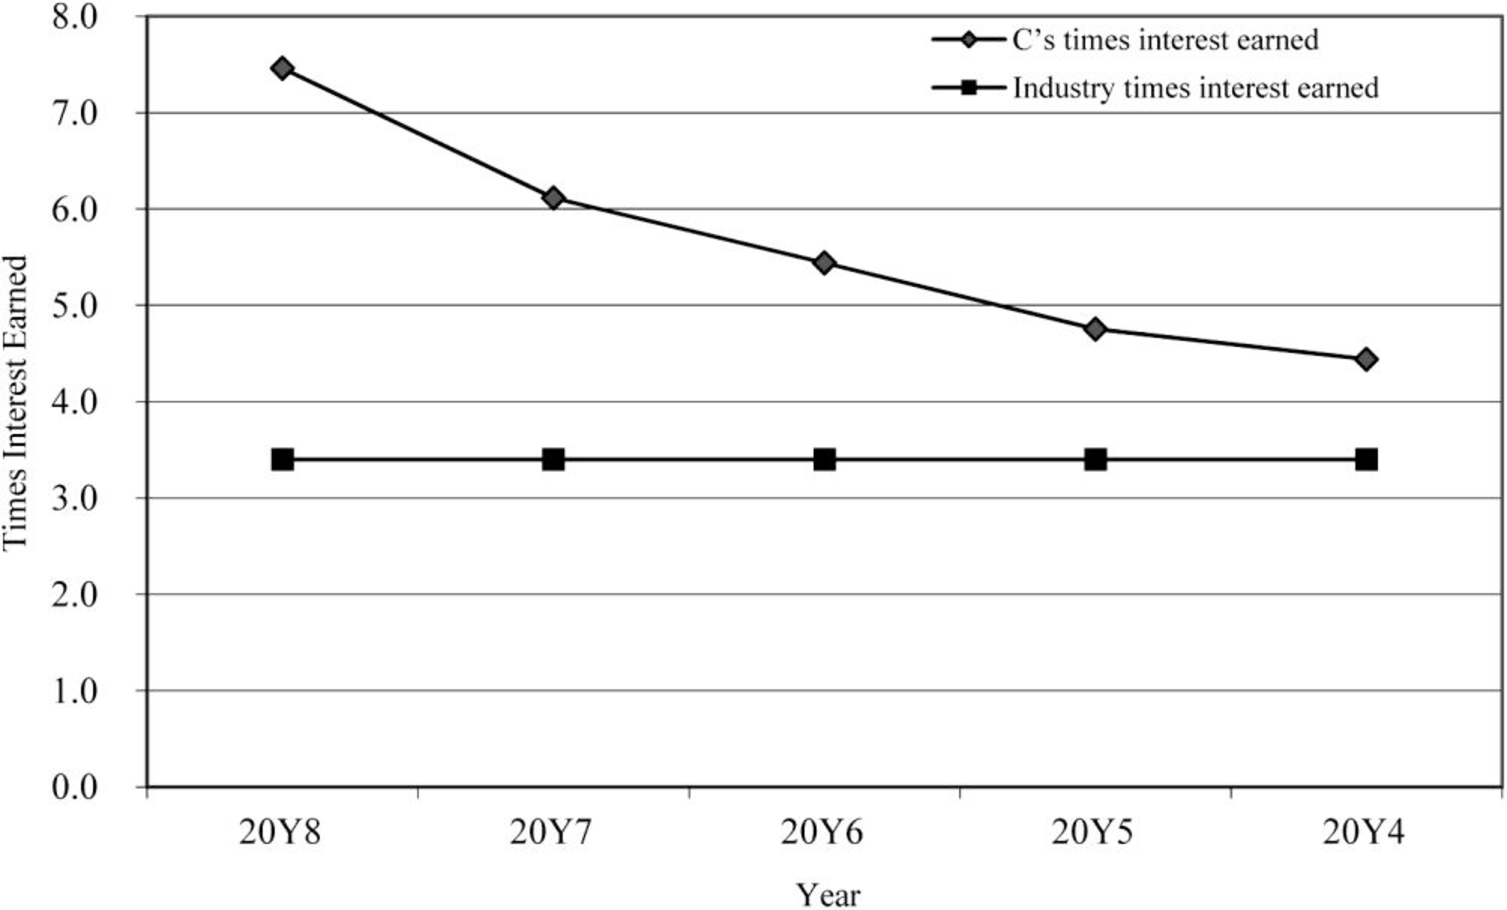
Figure (3)
Ratio of liabilities to stockholders’ equity
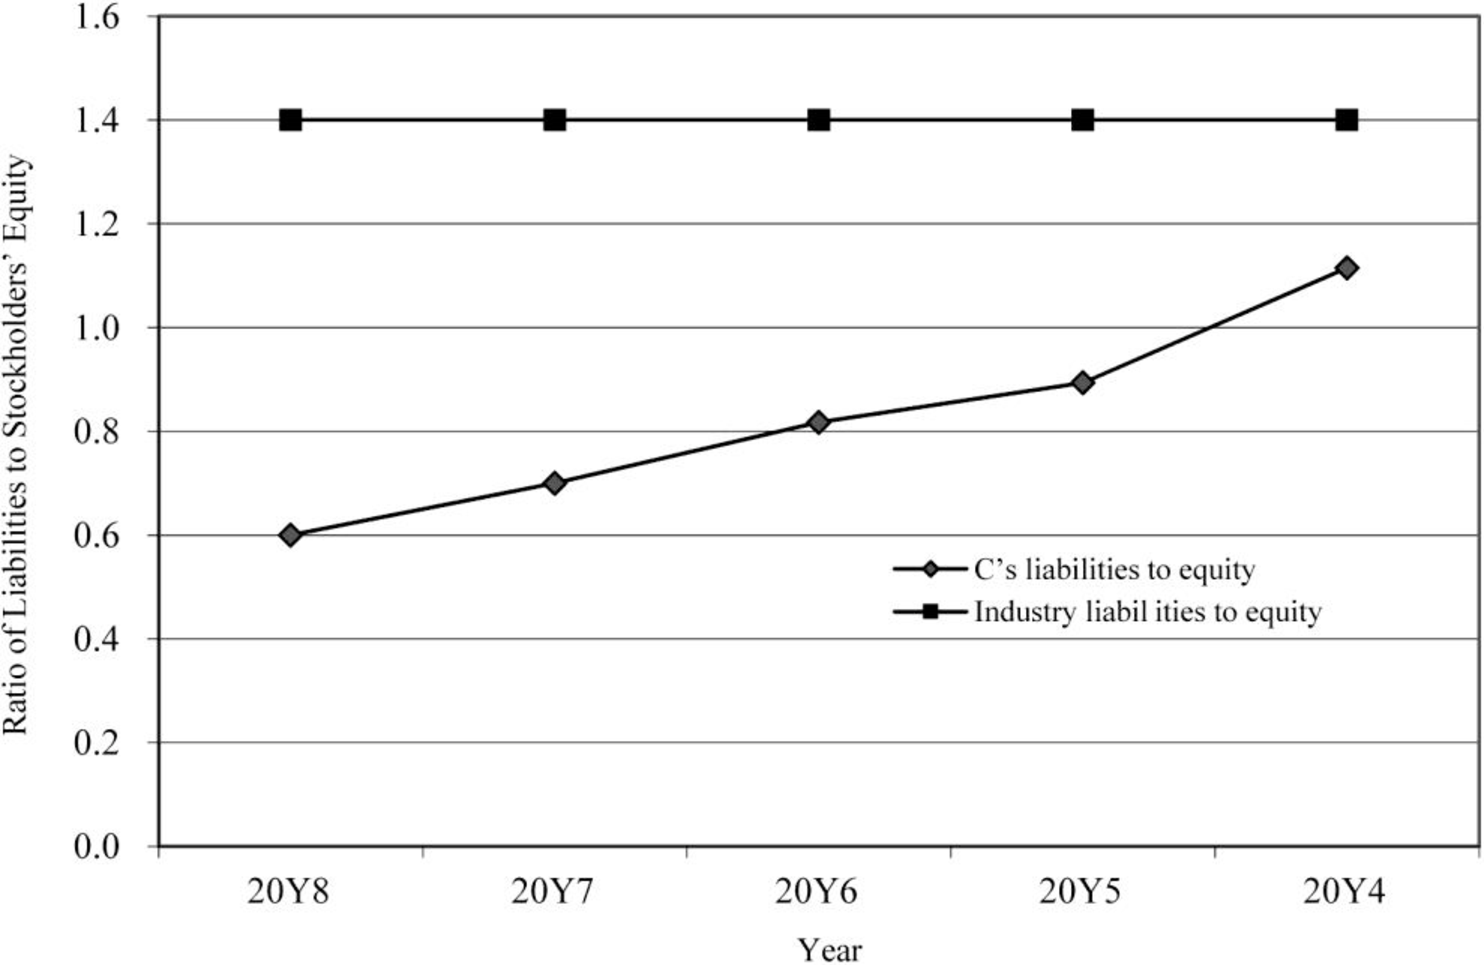
Figure (4)
2.
Prepare analysis of graphs.
2.
Explanation of Solution
Analysis:
- • The return on total assets and return on stockholders’ equity are in increasing trend for the last five years. There is a positive use of leverage. It is evident through the above ratios.
- • The ratio of liabilities to stockholders’ equity shows that the proportion of debt to stockholders’ equity is declining over the period.
- • The level of debt has been relative to the equity and has improved in the five years.
- • The times interest earned ratio is improving
- • g when compared to industry average.
Want to see more full solutions like this?
Chapter 16 Solutions
Managerial Accounting


 Managerial AccountingAccountingISBN:9781337912020Author:Carl Warren, Ph.d. Cma William B. TaylerPublisher:South-Western College Pub
 Managerial Accounting: The Cornerstone of Busines...AccountingISBN:9781337115773Author:Maryanne M. Mowen, Don R. Hansen, Dan L. HeitgerPublisher:Cengage Learning
 Financial AccountingAccountingISBN:9781337272124Author:Carl Warren, James M. Reeve, Jonathan DuchacPublisher:Cengage Learning
 College Accounting, Chapters 1-27AccountingISBN:9781337794756Author:HEINTZ, James A.Publisher:Cengage Learning,
 Financial AccountingAccountingISBN:9781305088436Author:Carl Warren, Jim Reeve, Jonathan DuchacPublisher:Cengage Learning
 Financial Accounting: The Impact on Decision Make...AccountingISBN:9781305654174Author:Gary A. Porter, Curtis L. NortonPublisher:Cengage Learning