
Videos
1(a)
Determine return on total assets for five years (20Y4 to 20Y8).
1(a)
Explanation of Solution
Financial Ratios: Financial ratios are the metrics used to evaluate the liquidity, capabilities, profitability, and overall performance of a company.
Determine return on total assets for five years (20Y4 to 20Y8).
Return on assets determines the particular company’s overall earning power. It is determined by dividing sum of net income and interest expense and average total assets.
Formula:
1(b)
Determine return on
1(b)
Explanation of Solution
Formula:
1(c)
Determine times interest earned ratio for five years.
1(c)
Explanation of Solution
Times interest earned ratio for five years
Times interest earned ratio quantifies the number of times the earnings before interest and taxes can pay the interest expense. First, determine the sum of income before income tax and interest expense. Then, divide the sum by interest expense.
Formula:
1(d)
Determine ratio of liabilities to stockholders’ equity for five years (20Y4 to 20Y8).
1(d)
Explanation of Solution
Ratio of liabilities to stockholders’ equity is determined by dividing liabilities and stockholders’ equity. Liabilities are determined as the difference between ending balance of assets and stockholders’ equity.
Formula:
Display the determined ratios in a graph.
Explanation of Solution
Return on total assets
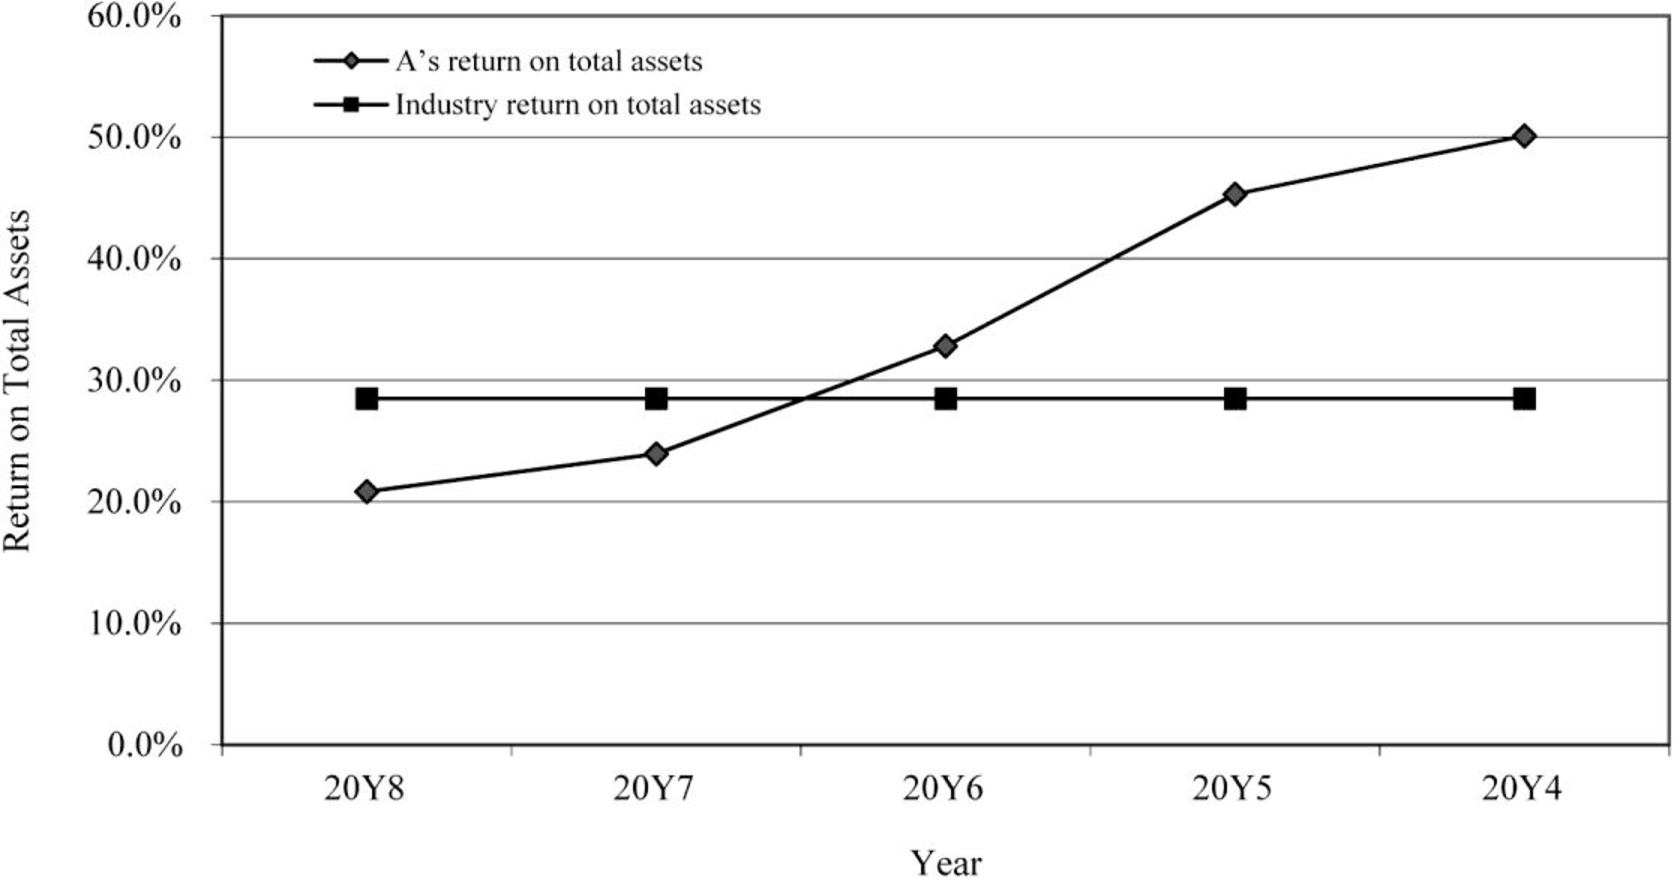
Figure (1)
Return on stockholders’ equity
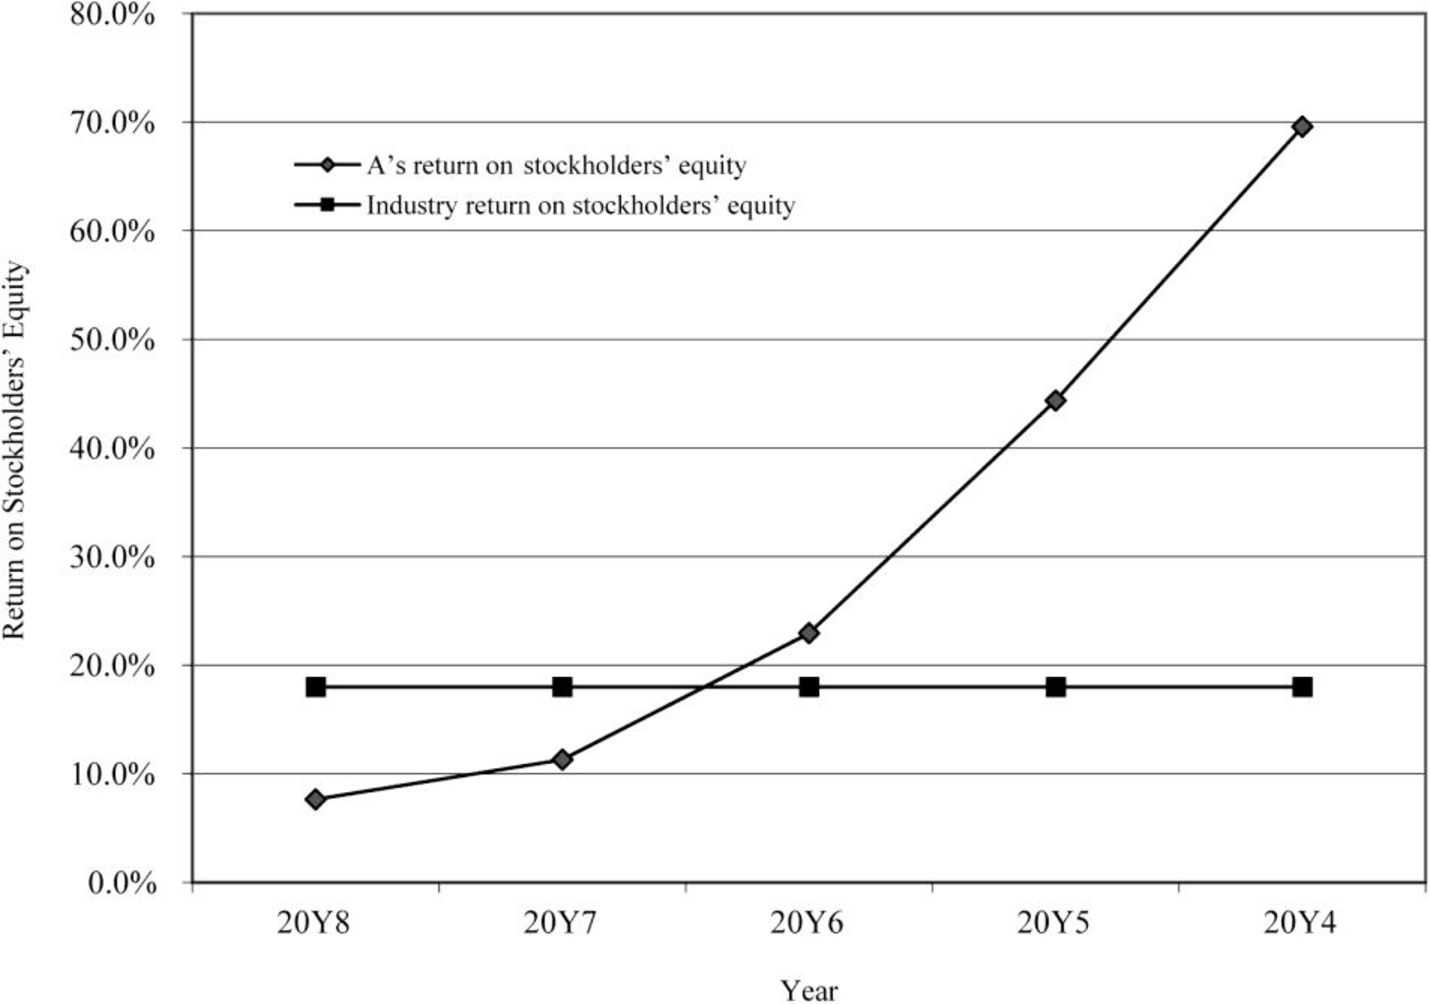
Figure (2)
Times interest earned ratio
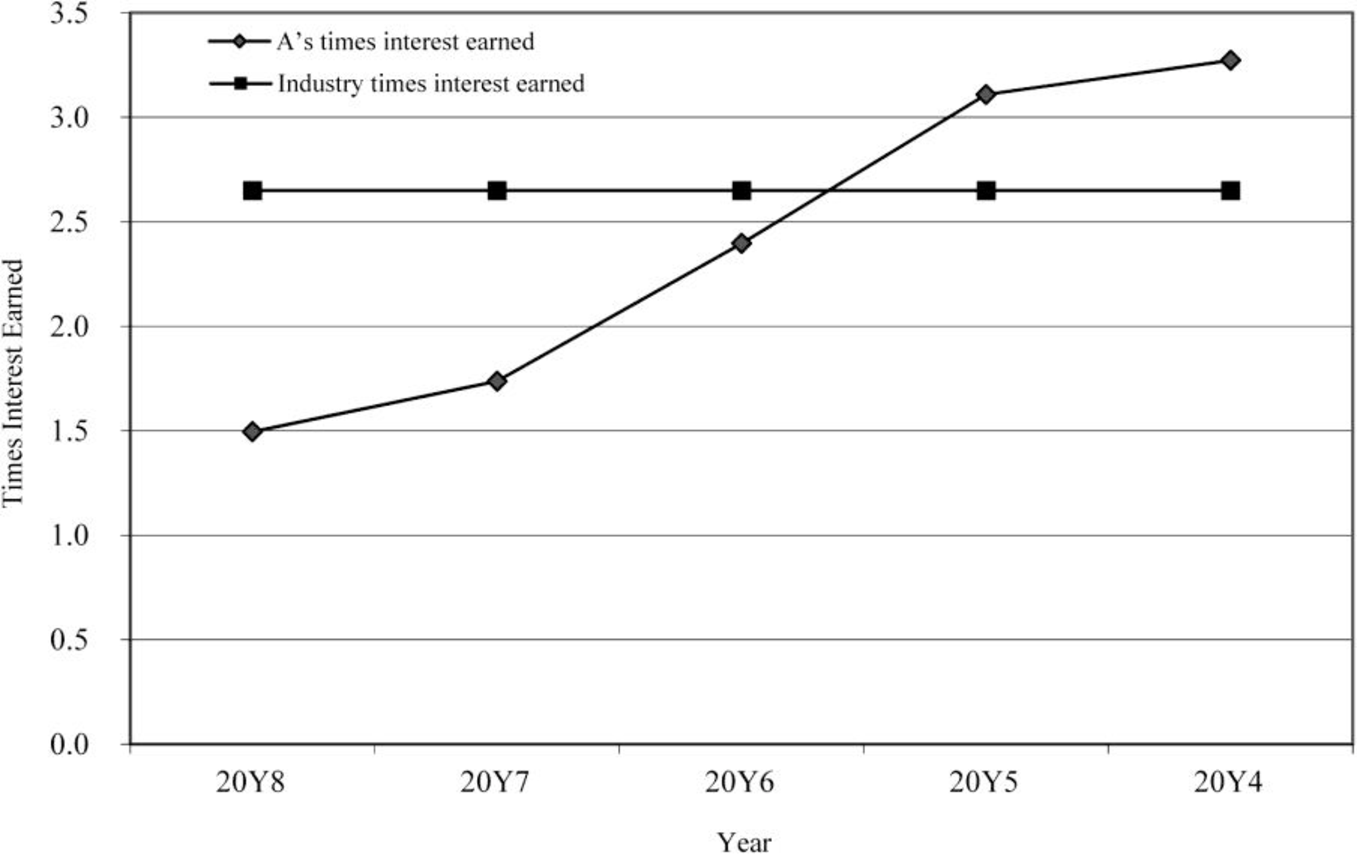
Figure (3)
Ratio of liabilities to stockholders’ equity
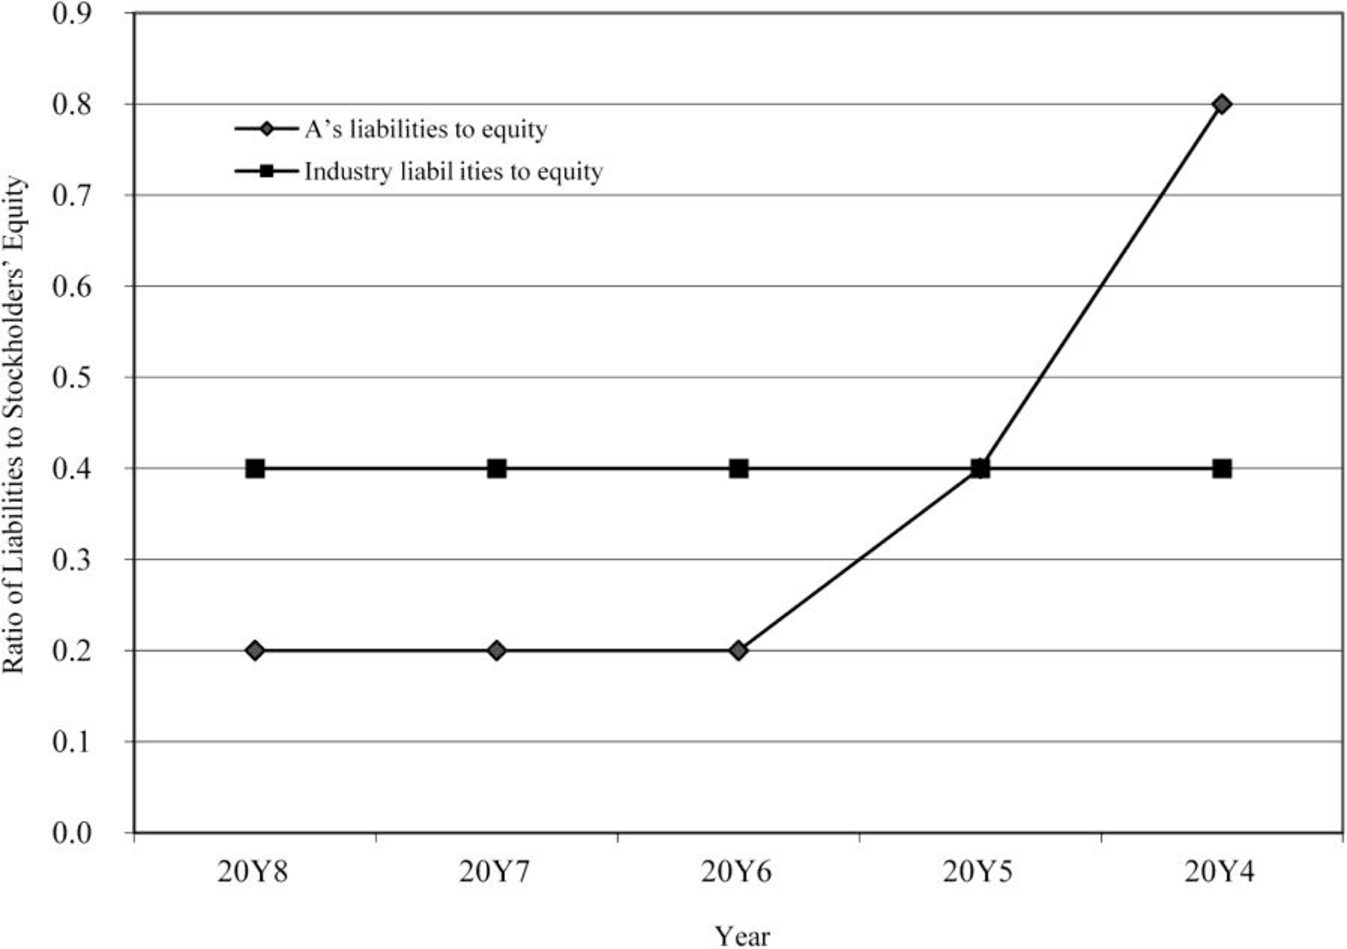
Figure (4)
2.
Prepare analysis of graphs.
2.
Explanation of Solution
Analysis:
- • The return on total assets and return on stockholders’ equity is negative trend for the last five years. These measures have moved below the industry average. The reason behind this might be due to decline in the amount of earnings earned.
- • The use of debt is very evident from the ratio of liabilities to stockholders’ equity and it is in the declining pace.
- • The level of debt has been relative to the equity and has improved in the five years.
- • The times interest earned ratio is below the industry average.
Want to see more full solutions like this?
Chapter 16 Solutions
Managerial Accounting


- Can you help me solve this general accounting problem using the correct accounting process?arrow_forwardGregory Nutrition Co. uses process costing to account for the production of protein shakes. Direct materials are added at the beginning of the process, and conversion costs are incurred uniformly throughout the process. Equivalent units have been calculated to be 25,800 units for materials and 22,400 units for conversion costs. Beginning inventory consisted of $18,600 in materials and $9,500 in conversion costs. June costs were $78,200 for materials and $84,600 for conversion costs. The ending inventory still in process was 6,800 units (100% complete for materials, 40% for conversion). The cost per equivalent unit for materials using the weighted-average method would be____. Helparrow_forwardgeneral accountingarrow_forward
- Can you explain this financial accounting question using accurate calculation methods?arrow_forwardOn June 30, Caldwell Industries issued a $12,000, 7%, 9-month note to the Central Community Bank. The entry on Caldwell's books to record the payment of the note at maturity will include a credit to Cash for: a. $12,000. b. $12,630. c. $12,840. d. $12,210.arrow_forwardPlease provide the solution to this general accounting question using proper accounting principles.arrow_forward
 Managerial AccountingAccountingISBN:9781337912020Author:Carl Warren, Ph.d. Cma William B. TaylerPublisher:South-Western College Pub
 Managerial Accounting: The Cornerstone of Busines...AccountingISBN:9781337115773Author:Maryanne M. Mowen, Don R. Hansen, Dan L. HeitgerPublisher:Cengage Learning
 Financial AccountingAccountingISBN:9781337272124Author:Carl Warren, James M. Reeve, Jonathan DuchacPublisher:Cengage Learning
 College Accounting, Chapters 1-27AccountingISBN:9781337794756Author:HEINTZ, James A.Publisher:Cengage Learning,
 Financial AccountingAccountingISBN:9781305088436Author:Carl Warren, Jim Reeve, Jonathan DuchacPublisher:Cengage Learning
 Financial Accounting: The Impact on Decision Make...AccountingISBN:9781305654174Author:Gary A. Porter, Curtis L. NortonPublisher:Cengage Learning