The specific growth rate of a yeast that produces an antibiotic is a function of the food concentration c,
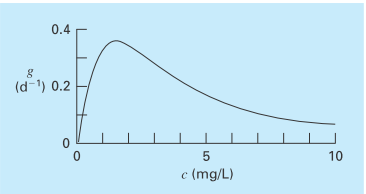
As depicted in Fig. P16.4, growth goes to zero at very low concentrations due to food limitation. It also goes to zero at high concentrations due to toxicity effects. Find the value of c at which growth is a maximum.

FIGURE P16.4
The specific growth rate of a yeast that produces an antibiotic versus the food concentration.
Want to see the full answer?
Check out a sample textbook solution
Chapter 16 Solutions
EBK NUMERICAL METHODS FOR ENGINEERS
- A piston-cylinder device contains 0.87 kg of refrigerant-134a at -10°C. The piston that is free to move has a mass of 12 kg and a diameter of 25 cm. The local atmospheric pressure is 88 kPa. Now, heat is transferred to refrigerant-134a until the temperature is 15°C. Use data from the tables. R-134a -10°C Determine the change in the volume of the cylinder of the refrigerant-134a if the specific volume and enthalpy of R-134a at the initial state of 90.4 kPa and -10°C and at the final state of 90.4 kPa and 15°C are as follows: = 0.2418 m³/kg, h₁ = 247.77 kJ/kg 3 v2 = 0.2670 m³/kg, and h₂ = 268.18 kJ/kg The change in the volume of the cylinder is marrow_forwardA piston-cylinder device contains 0.87 kg of refrigerant-134a at -10°C. The piston that is free to move has a mass of 12 kg and a diameter of 25 cm. The local atmospheric pressure is 88 kPa. Now, heat is transferred to refrigerant-134a until the temperature is 15°C. Use data from the tables. R-134a -10°C Determine the final pressure of the refrigerant-134a. The final pressure is kPa.arrow_forwardThe hydraulic cylinder BC exerts on member AB a force P directed along line BC. The force P must have a 560-N component perpendicular to member AB. A M 45° 30° C Determine the force component along line AB. The force component along line AB is N.arrow_forward
- ! Required information A telephone cable is clamped at A to the pole AB. The tension in the left-hand portion of the cable is given to be T₁ = 815 lb. A 15° 25° B T₂ Using trigonometry, determine the required tension T₂ in the right-hand portion if the resultant R of the forces exerted by the cable at A is to be vertical. The required tension is lb.arrow_forwardWhat are examples of at least three (3) applications of tolerance fitting analysis.arrow_forwardThe primary material used in the production of glass products is silica sand. True or Falsearrow_forward
- Which one of the following is the most common polymer type in fiber-reinforced polymer composites? thermosets thermoplastics elastomers none of the abovearrow_forwardA pattern for a product is larger than the actual finished part. True or Falsearrow_forwardIn the lost foam process, the pattern doesn’t need to be removed from the mold. True or Falsearrow_forward
- Tempering eliminates internal stresses in glass. True or Falsearrow_forwardThermoset polymers can be recycled with little to no degradation in properties. True or Falsearrow_forwardTwo forces are applied as shown to a hook support. The magnitude of P is 38 N. 50 N 25° DG a 터 Using trigonometry, determine the required angle a such that the resultant R of the two forces applied to the support will be horizontal. The value of a isarrow_forward
 Elements Of ElectromagneticsMechanical EngineeringISBN:9780190698614Author:Sadiku, Matthew N. O.Publisher:Oxford University Press
 Mechanics of Materials (10th Edition)Mechanical EngineeringISBN:9780134319650Author:Russell C. HibbelerPublisher:PEARSON
 Thermodynamics: An Engineering ApproachMechanical EngineeringISBN:9781259822674Author:Yunus A. Cengel Dr., Michael A. BolesPublisher:McGraw-Hill Education
 Control Systems EngineeringMechanical EngineeringISBN:9781118170519Author:Norman S. NisePublisher:WILEY
 Mechanics of Materials (MindTap Course List)Mechanical EngineeringISBN:9781337093347Author:Barry J. Goodno, James M. GerePublisher:Cengage Learning
 Engineering Mechanics: StaticsMechanical EngineeringISBN:9781118807330Author:James L. Meriam, L. G. Kraige, J. N. BoltonPublisher:WILEY


