
1.
Prepare an overview contribution plan income statement for each of the two years, and measure the difference in operating income.
1.
Explanation of Solution
Productivity is the ratio between output and input. It is an indicator of the output produced per unit or per input dollar. It describes different measures of productive efficiency. Therefore, productivity improves when partial productivity increases. Both the input (denominator) and the output (numerator) may be in unit or dollar amount. Calculating productivity primarily aims at improving operation. Enhancements to high- value - added activities reduce the activity costs and/or enhance output value. Low-value - added activities should be eradicated rather than improved. Financial productivity evaluates the output-to-cost relationship of one or more input resources. It is an indicator of the output unit or the output sales values of one or more resources produced per dollar. Partial productivity indices are as many as there are production factors. The most important and frequently used are the partial indices of labor and capital productivity. The partial productivity measures are measures of the nominal price value, physical measures and measurements of fixed price values. Measuring partial productivity concerns designed to measure solutions that do not satisfy the requirements of total productivity measurement, even so, if it will be feasible as total productivity indicators. Productivity describes different measures of productive efficiency. Therefore, productivity improves when partial productivity increases.
Compute the contribution plan income statement for each of the two years:
| Particulars | Current year | Prior year |
| Sales: | ||
| Current year (20,000 × $40) | $800,000 | |
| Prior year (16,000 × $40) | $640,000 | |
| Variable cost of sales: | ||
| Materials (14,000 × $10); (13,000 × $8) | $140,000 | $104,000 |
| Labor (5,250 × $25); (6,000 × $20) | 131,250 | 120,000 |
| Power (2,000 × $2); (1,000 × $2) | 4,000 | 2,000 |
| Total variable cost of sales | $275,250 | $226,000 |
| Contribution margin | $524,750 | $414,000 |
Calculate changes in profits from the prior year to the current year:
2.
For each year, calculate the partial operational productivity ratios for each production factor.
2.
Explanation of Solution
Productivity is the ratio between output and input. It is an indicator of the output produced per unit or per input dollar. It describes different measures of productive efficiency. Therefore, productivity improves when partial productivity increases. Both the input (denominator) and the output (numerator) may be in unit or dollar amount. Calculating productivity primarily aims at improving operation. Enhancements to high- value - added activities reduce the activity costs and/or enhance output value. Low-value - added activities should be eradicated rather than improved. Financial productivity evaluates the output-to-cost relationship of one or more input resources. It is an indicator of the output unit or the output sales values of one or more resources produced per dollar. Partial productivity indices are as many as there are production factors. The most important and frequently used are the partial indices of labor and capital productivity. The partial productivity measures are measures of the nominal price value, physical measures and measurements of fixed price values. Measuring partial productivity concerns designed to measure solutions that do not satisfy the requirements of total productivity measurement, even so, if it will be feasible as total productivity indicators. Productivity describes different measures of productive efficiency. Therefore, productivity improves when partial productivity increases.
| Current year | Prior year | ||||
| Units manufactured | 20,000 | 16,000 | |||
| Materials used | 14,000 | 13,000 | |||
| Number of labor hours used | 5,250 | 6,000 | |||
| Cost of materials used per pound | $10 | $8 | |||
| Direct labor wage rate/hr | $25 | $20 | |||
| Power used (kwh) | $ 2,000 | $ 1,000 | |||
| Cost of power (kwh) | $ 2 | $ 2 | |||
| Total materials cost | $140,000 | = 14,000 × $10 | $104,000 | ||
| Total Labor cost | $131,250 | = 5,250 × $25 | $120,000 | ||
| Total power cost | $4,000 | = 2,000 × $2 | $2,000 | ||
| Financial partial productivity | |||||
| Materials | 0.142857 | = 20,000/140,000 | 0.153846 | ||
| Labor | 0.152381 | = 20,000/131,250 | 0.133333 | ||
| Power | 5.000000 | = 20,000/4,000 | 8.000000 | ||
| Operational partial productivity | |||||
| Materials | 1.42857 | = 20,000/14,000 | 1.230769 | ||
| Labor | 3.80592 | = 20,000/5,250 | 2.666667 | ||
| Power | 10.00000 | = 20,000/2,000 | 16.000000 | ||
| Current Output at prior year productivity | |||||
| Materials | 16,250 | = 20,000/1.230769 | |||
| Labor | 7,500 | = 20,000/2.666667 | |||
| Power | 1,250 | = 20,000/16 |
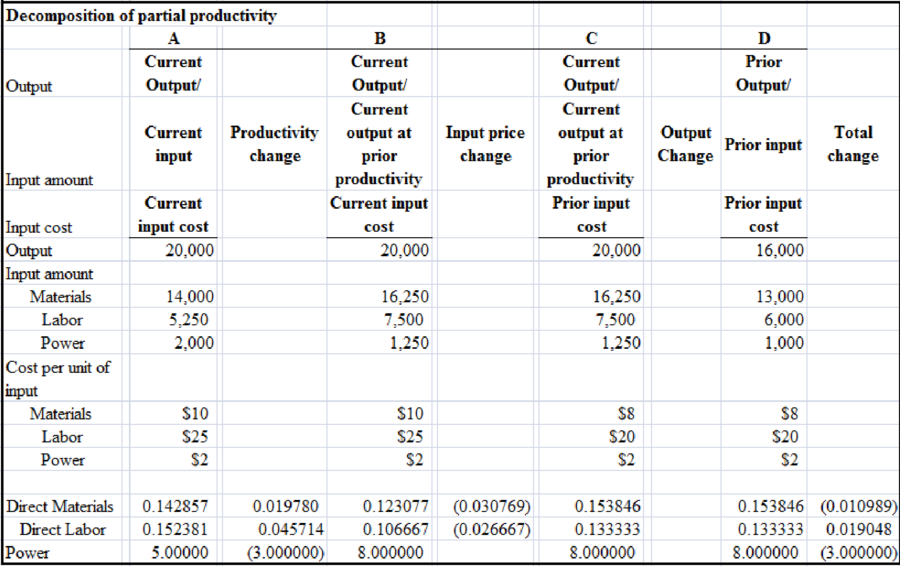
The image given below represents the decomposition of partial productivity:

3.
Compute the partial financial productivity ratios for each production factor in each year.
3.
Explanation of Solution
Productivity is the ratio between output and input. It is an indicator of the output produced per unit or per input dollar. It describes different measures of productive efficiency. Therefore, productivity improves when partial productivity increases. Both the input (denominator) and the output (numerator) may be in unit or dollar amount. Calculating productivity primarily aims at improving operation. Enhancements to high- value - added activities reduce the activity costs and/or enhance output value. Low-value - added activities should be eradicated rather than improved. Financial productivity evaluates the output-to-cost relationship of one or more input resources. It is an indicator of the output unit or the output sales values of one or more resources produced per dollar. Partial productivity indices are as many as there are production factors. The most important and frequently used are the partial indices of labor and capital productivity. The partial productivity measures are measures of the nominal price value, physical measures and measurements of fixed price values. Measuring partial productivity concerns designed to measure solutions that do not satisfy the requirements of total productivity measurement, even so, if it will be feasible as total productivity indicators. Productivity describes different measures of productive efficiency. Therefore, productivity improves when partial productivity increases.
| Current year | Prior year | ||||
| Units manufactured | 20,000 | 16,000 | |||
| Materials used | 14,000 | 13,000 | |||
| Number of labor hours used | 5,250 | 6,000 | |||
| Cost of materials used per pound | $10 | $8 | |||
| Direct labor wage rate/hr | $25 | $20 | |||
| Power used (kwh) | $ 2,000 | $ 1,000 | |||
| Cost of power (kwh) | $ 2 | $ 2 | |||
| Total materials cost | $140,000 | = 14,000 × $10 | $104,000 | ||
| Total Labor cost | $131,250 | = 5,250 × $25 | $120,000 | ||
| Total power cost | $4,000 | = 2,000 × $2 | $2,000 | ||
| Financial partial productivity | |||||
| Materials | 0.142857 | = 20,000/140,000 | 0.153846 | ||
| Labor | 0.152381 | = 20,000/131,250 | 0.133333 | ||
| Power | 5.000000 | = 20,000/4,000 | 8.000000 | ||
| Operational partial productivity | |||||
| Materials | 1.42857 | = 20,000/14,000 | 1.230769 | ||
| Labor | 3.80592 | = 20,000/5,250 | 2.666667 | ||
| Power | 10.00000 | = 20,000/2,000 | 16.000000 | ||
| Current Output at prior year productivity | |||||
| Materials | 16,250 | = 20,000/1.230769 | |||
| Labor | 7,500 | = 20,000/2.666667 | |||
| Power | 1,250 | = 20,000/16 |
The image given below represents the decomposition of partial productivity:
4.
State the conclusions that will be drawn about the firm’s productivity last year relative to the current year.
4.
Explanation of Solution
Productivity is the ratio between output and input. It is an indicator of the output produced per unit or per input dollar. It describes different measures of productive efficiency. Therefore, productivity improves when partial productivity increases. Both the input (denominator) and the output (numerator) may be in unit or dollar amount. Calculating productivity primarily aims at improving operation. Enhancements to high- value - added activities reduce the activity costs and/or enhance output value. Low-value - added activities should be eradicated rather than improved. Financial productivity evaluates the output-to-cost relationship of one or more input resources. It is an indicator of the output unit or the output sales values of one or more resources produced per dollar. Partial productivity indices are as many as there are production factors. The most important and frequently used are the partial indices of labor and capital productivity. The partial productivity measures are measures of the nominal price value, physical measures and measurements of fixed price values. Measuring partial productivity concerns designed to measure solutions that do not satisfy the requirements of total productivity measurement, even so, if it will be feasible as total productivity indicators. Productivity describes different measures of productive efficiency. Therefore, productivity improves when partial productivity increases.
| 2016 | 2015 | ||||
| Units manufactured | 750,000 | 1,000,000 | |||
| Units of CT 140 used | 900,000 | 1,050,000 | |||
| Number of labor hours used | 150,000 | 200,000 | |||
| Cost of CT140 per unit | $156 | $135 | |||
| Direct labor wage rate/hr | $56 | $62 | |||
| Total materials cost | $ 140,400,000 | = 900,000 × $156 | $141,750,000 | ||
| Total labor cost | $ 8,400,000 | = 150,000 × $56 | $ 12,400,000 | ||
| Total materials and labor cost | $ 148,800,000 | $154,150,000 | |||
| Financial partial productivity | |||||
| Materials | 0.005342 | = 750,000/140,400,000 | 0.007055 | ||
| Labor | 0.089286 | = 750,000/8,400,000 | 0.080645 | ||
| Operational partial productivity | |||||
| Materials | 0.83333 | = 750,000/900,000 | 0.952381 | ||
| Labor | 5.00000 | = 750,000/150,000 | 5.000000 | ||
| Current Output at prior year productivity | |||||
| Materials | 787,500.00 | = 750,000/.952381 | |||
| Labor | 150,000.00 | = 750,000/5.0 |

Both direct materials and part-productivity direct operating labor changed from the previous year to the present year. In the current year the company has been able to produce more output units for each unit of materials placed in production and for every hour spent on production. Operational resource output decreased from that of the prior year in the current year. During the current year, the company is likely to have used more machinery during manufacturing that reduced material consumption and hours of manufacturing. Economic partial output for both direct and power materials decreased from the prior year. The rises in prices of direct materials were higher than the gains in partial operating efficiency for direct materials.
The financial partial productivity for direct labor improved. However, the scale of the changes is much smaller than the increase in partial efficiency for operations. In the current year, direct labor-operating partial efficiency increased by 42.8 percent over the previous years. Even so, financial partial efficiency increased between the two years by just 14.3 per cent. The decline in partial financial productivity is possibly due to increases in direct labor wage levels.
5.
Split the changes in the partial financial productivity ratio from prior year to the current year into changes in productivity, changes in input prices and changes in output.
5.
Explanation of Solution
Productivity is the ratio between output and input. It is an indicator of the output produced per unit or per input dollar. It describes different measures of productive efficiency. Therefore, productivity improves when partial productivity increases. Both the input (denominator) and the output (numerator) may be in unit or dollar amount. Calculating productivity primarily aims at improving operation. Enhancements to high- value - added activities reduce the activity costs and/or enhance output value. Low-value - added activities should be eradicated rather than improved. Financial productivity evaluates the output-to-cost relationship of one or more input resources. It is an indicator of the output unit or the output sales values of one or more resources produced per dollar. Partial productivity indices are as many as there are production factors. The most important and frequently used are the partial indices of labor and capital productivity. The partial productivity measures are measures of the nominal price value, physical measures and measurements of fixed price values. Measuring partial productivity concerns designed to measure solutions that do not satisfy the requirements of total productivity measurement, even so, if it will be feasible as total productivity indicators. Productivity describes different measures of productive efficiency. Therefore, productivity improves when partial productivity increases.
| 2016 | 2015 | ||||
| Units manufactured | 750,000 | 1,000,000 | |||
| Units of CT 140 used | 900,000 | 1,050,000 | |||
| Number of labor hours used | 150,000 | 200,000 | |||
| Cost of CT140 per unit | $156 | $135 | |||
| Direct labor wage rate/hr | $56 | $62 | |||
| Total materials cost | $ 140,400,000 | = 900,000 × $156 | $141,750,000 | ||
| Total labor cost | $ 8,400,000 | = 150,000 × $56 | $ 12,400,000 | ||
| Total materials and labor cost | $ 148,800,000 | $154,150,000 | |||
| Financial partial productivity | |||||
| Materials | 0.005342 | = 750,000/140,400,000 | 0.007055 | ||
| Labor | 0.089286 | = 750,000/8,400,000 | 0.080645 | ||
| Operational partial productivity | |||||
| Materials | 0.83333 | = 750,000/900,000 | 0.952381 | ||
| Labor | 5.00000 | = 750,000/150,000 | 5.000000 | ||
| Current Output at prior year productivity | |||||
| Materials | 787,500.00 | = 750,000/.952381 | |||
| Labor | 150,000.00 | = 750,000/5.0 |

6.
Mention that any further insight into the relative productivity of Company, C for the prior year and the current year will be generated by the detailed information provided by separating the change in the partial financial productivity rate.
6.
Explanation of Solution
Productivity is the ratio between output and input. It is an indicator of the output produced per unit or per input dollar. It describes different measures of productive efficiency. Therefore, productivity improves when partial productivity increases. Both the input (denominator) and the output (numerator) may be in unit or dollar amount. Calculating productivity primarily aims at improving operation. Enhancements to high- value - added activities reduce the activity costs and/or enhance output value. Low-value - added activities should be eradicated rather than improved. Financial productivity evaluates the output-to-cost relationship of one or more input resources. It is an indicator of the output unit or the output sales values of one or more resources produced per dollar. Partial productivity indices are as many as there are production factors. The most important and frequently used are the partial indices of labor and capital productivity. The partial productivity measures are measures of the nominal price value, physical measures and measurements of fixed price values. Measuring partial productivity concerns designed to measure solutions that do not satisfy the requirements of total productivity measurement, even so, if it will be feasible as total productivity indicators. Productivity describes different measures of productive efficiency. Therefore, productivity improves when partial productivity increases.
| 2016 | 2015 | ||||
| Units manufactured | 750,000 | 1,000,000 | |||
| Units of CT 140 used | 900,000 | 1,050,000 | |||
| Number of labor hours used | 150,000 | 200,000 | |||
| Cost of CT140 per unit | $156 | $135 | |||
| Direct labor wage rate/hr | $56 | $62 | |||
| Total materials cost | $ 140,400,000 | = 900,000 × $156 | $141,750,000 | ||
| Total labor cost | $ 8,400,000 | = 150,000 × $56 | $ 12,400,000 | ||
| Total materials and labor cost | $ 148,800,000 | $154,150,000 | |||
| Financial partial productivity | |||||
| Materials | 0.005342 | = 750,000/140,400,000 | 0.007055 | ||
| Labor | 0.089286 | = 750,000/8,400,000 | 0.080645 | ||
| Operational partial productivity | |||||
| Materials | 0.83333 | = 750,000/900,000 | 0.952381 | ||
| Labor | 5.00000 | = 750,000/150,000 | 5.000000 | ||
| Current Output at prior year productivity | |||||
| Materials | 787,500.00 | = 750,000/.952381 | |||
| Labor | 150,000.00 | = 750,000/5.0 |
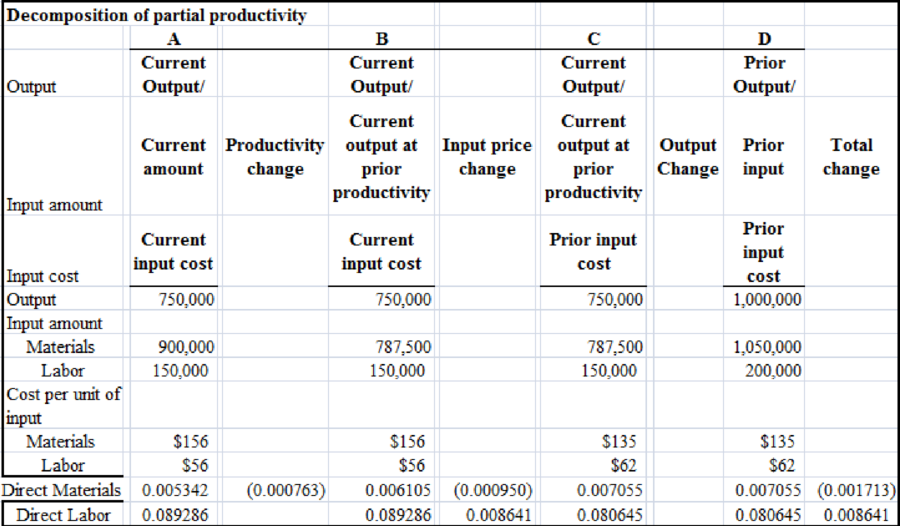
In the current year, productivity increased for both raw products and direct labor costs. The % of productivity improvements are 12.86 (= .019780 ÷153846) and 34.29 (= .045714 ÷ 13333) of the productivity of the previous year for direct materials and direct labor, respectively. Cost increases in raw materials and direct labor, though, reduced productivity gains on these two sources of growth.
Want to see more full solutions like this?
Chapter 16 Solutions
Cost Management: A Strategic Emphasis

- ???? Need Answer ASAParrow_forwardOrville Manufacturing Company's work-in-process inventory on August 1 has a balance of $32,400, representing Job No. 527. During August, $61,500 of direct materials were requisitioned for Job No. 527, and $42,800 of direct labor cost was incurred on Job No. 527. Manufacturing overhead is allocated at 125% of direct labor cost. Actual manufacturing overhead costs incurred in August amounted to $52,500. No new jobs were started during August. Job No. 527 is completed on August 28. Is manufacturing overhead overallocated or underallocated for the month of August and by how much?arrow_forwardAnswer mearrow_forward

 AccountingAccountingISBN:9781337272094Author:WARREN, Carl S., Reeve, James M., Duchac, Jonathan E.Publisher:Cengage Learning,
 Accounting Information SystemsAccountingISBN:9781337619202Author:Hall, James A.Publisher:Cengage Learning,
 Horngren's Cost Accounting: A Managerial Emphasis...AccountingISBN:9780134475585Author:Srikant M. Datar, Madhav V. RajanPublisher:PEARSON
 Intermediate AccountingAccountingISBN:9781259722660Author:J. David Spiceland, Mark W. Nelson, Wayne M ThomasPublisher:McGraw-Hill Education
 Financial and Managerial AccountingAccountingISBN:9781259726705Author:John J Wild, Ken W. Shaw, Barbara Chiappetta Fundamental Accounting PrinciplesPublisher:McGraw-Hill Education