
1.
Calculate for the year, 2015 and 2016, the partial financial productivity ratios.
1.
Explanation of Solution
Productivity is the ratio between output and input. It is an indicator of the output produced per unit or per input dollar. It describes different measures of productive efficiency. Therefore, productivity improves when partial productivity increases. Both the input (denominator) and the output (numerator) may be in unit or dollar amount. Calculating productivity primarily aims at improving operation. Enhancements to high- value - added activities reduce the activity costs and/or enhance output value. Low-value - added activities should be eradicated rather than improved. Financial productivity evaluates the output-to-cost relationship of one or more input resources. It is an indicator of the output unit or the output sales values of one or more resources produced per dollar. Partial productivity indices are as many as there are production factors. The most important and frequently used are the partial indices of labor and capital productivity. The partial productivity measures are measures of the nominal price value, physical measures and measurements of fixed price values. Measuring partial productivity concerns designed to measure solutions that do not satisfy the requirements of total productivity measurement, even so, if it will be feasible as total productivity indicators. Productivity describes different measures of productive efficiency. Therefore, productivity improves when partial productivity increases.
| 2016 | 2015 | ||||
| Units manufactured | 750,000 | 1,000,000 | |||
| Units of CT 140 used | 900,000 | 1,050,000 | |||
| Number of labor hours used | 150,000 | 200,000 | |||
| Cost of CT140 per unit | $156 | $135 | |||
| Direct labor wage rate/hr | $56 | $62 | |||
| Total materials cost | $ 140,400,000 | = 900,000 × $156 | $141,750,000 | ||
| Total labor cost | $ 8,400,000 | = 150,000 × $56 | $ 12,400,000 | ||
| Total materials and labor cost | $ 148,800,000 | $154,150,000 | |||
| Financial partial productivity | |||||
| Materials | 0.005342 | = 750,000/140,400,000 | 0.007055 | ||
| Labor | 0.089286 | = 750,000/8,400,000 | 0.080645 | ||
| Operational partial productivity | |||||
| Materials | 0.83333 | = 750,000/900,000 | 0.952381 | ||
| Labor | 5.00000 | = 750,000/150,000 | 5.000000 | ||
| Current Output at prior year productivity | |||||
| Materials | 787,500.00 | = 750,000/.952381 | |||
| Labor | 150,000.00 | = 750,000/5.0 |
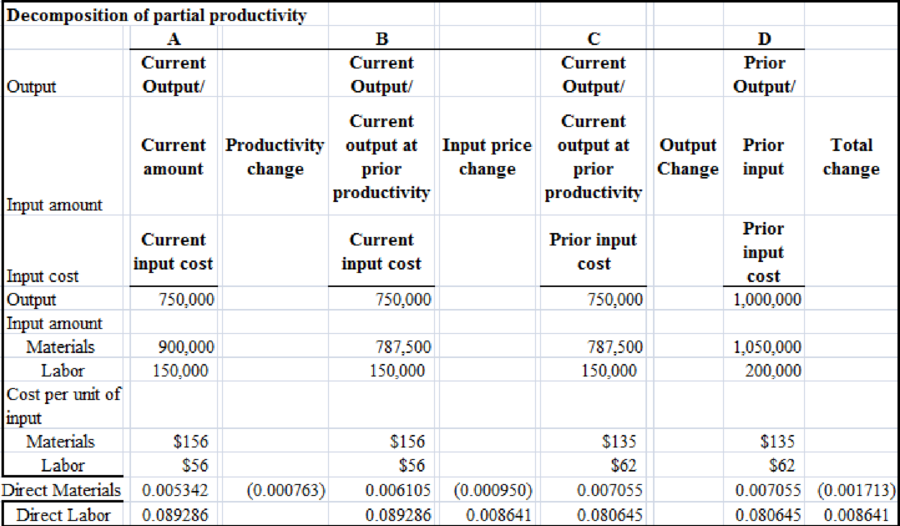
The image given below represents the decomposition of partial productivity:

Compute the partial financial productivity ratios for 2015 and 2016:
| Financial partial productivity | 2016 | 2015 | |
| Materials | 0.00534 | = 750,000/140,400,000 | 0.00705 |
| Labor | 0.08929 | = 750,000/8,400,000 | 0.08065 |
2.
State the conclusions that will be drawn about the firm’s productivity in 2016 relative to 2015.
2.
Explanation of Solution
Productivity is the ratio between output and input. It is an indicator of the output produced per unit or per input dollar. It describes different measures of productive efficiency. Therefore, productivity improves when partial productivity increases. Both the input (denominator) and the output (numerator) may be in unit or dollar amount. Calculating productivity primarily aims at improving operation. Enhancements to high- value - added activities reduce the activity costs and/or enhance output value. Low-value - added activities should be eradicated rather than improved. Financial productivity evaluates the output-to-cost relationship of one or more input resources. It is an indicator of the output unit or the output sales values of one or more resources produced per dollar. Partial productivity indices are as many as there are production factors. The most important and frequently used are the partial indices of labor and capital productivity. The partial productivity measures are measures of the nominal price value, physical measures and measurements of fixed price values. Measuring partial productivity concerns designed to measure solutions that do not satisfy the requirements of total productivity measurement, even so, if it will be feasible as total productivity indicators. Productivity describes different measures of productive efficiency. Therefore, productivity improves when partial productivity increases.
| 2016 | 2015 | ||||
| Units manufactured | 750,000 | 1,000,000 | |||
| Units of CT 140 used | 900,000 | 1,050,000 | |||
| Number of labor hours used | 150,000 | 200,000 | |||
| Cost of CT140 per unit | $156 | $135 | |||
| Direct labor wage rate/hr | $56 | $62 | |||
| Total materials cost | $ 140,400,000 | = 900,000 × $156 | $141,750,000 | ||
| Total labor cost | $ 8,400,000 | = 150,000 × $56 | $ 12,400,000 | ||
| Total materials and labor cost | $ 148,800,000 | $154,150,000 | |||
| Financial partial productivity | |||||
| Materials | 0.005342 | = 750,000/140,400,000 | 0.007055 | ||
| Labor | 0.089286 | = 750,000/8,400,000 | 0.080645 | ||
| Operational partial productivity | |||||
| Materials | 0.83333 | = 750,000/900,000 | 0.952381 | ||
| Labor | 5.00000 | = 750,000/150,000 | 5.000000 | ||
| Current Output at prior year productivity | |||||
| Materials | 787,500.00 | = 750,000/.952381 | |||
| Labor | 150,000.00 | = 750,000/5.0 |
The image given below represents the decomposition of partial productivity:

Financial partial productivity of direct materials declined from.00705 in 2015 to.00534 in 2016. Direct financial labor partial productivity increased from 0.08065 in 2015 to 0.08929 in 2016.
3.
Split the changes in the partial financial productivity ratio from 2015 to 2016 into changes in productivity, changes in input prices and changes in output..
3.
Explanation of Solution
Productivity is the ratio between output and input. It is an indicator of the output produced per unit or per input dollar. It describes different measures of productive efficiency. Therefore, productivity improves when partial productivity increases. Both the input (denominator) and the output (numerator) may be in unit or dollar amount. Calculating productivity primarily aims at improving operation. Enhancements to high- value - added activities reduce the activity costs and/or enhance output value. Low-value - added activities should be eradicated rather than improved. Financial productivity evaluates the output-to-cost relationship of one or more input resources. It is an indicator of the output unit or the output sales values of one or more resources produced per dollar. Partial productivity indices are as many as there are production factors. The most important and frequently used are the partial indices of labor and capital productivity. The partial productivity measures are measures of the nominal price value, physical measures and measurements of fixed price values. Measuring partial productivity concerns designed to measure solutions that do not satisfy the requirements of total productivity measurement, even so, if it will be feasible as total productivity indicators. Productivity describes different measures of productive efficiency. Therefore, productivity improves when partial productivity increases.
| 2016 | 2015 | ||||
| Units manufactured | 750,000 | 1,000,000 | |||
| Units of CT 140 used | 900,000 | 1,050,000 | |||
| Number of labor hours used | 150,000 | 200,000 | |||
| Cost of CT140 per unit | $156 | $135 | |||
| Direct labor wage rate/hr | $56 | $62 | |||
| Total materials cost | $ 140,400,000 | = 900,000 × $156 | $141,750,000 | ||
| Total labor cost | $ 8,400,000 | = 150,000 × $56 | $ 12,400,000 | ||
| Total materials and labor cost | $ 148,800,000 | $154,150,000 | |||
| Financial partial productivity | |||||
| Materials | 0.005342 | = 750,000/140,400,000 | 0.007055 | ||
| Labor | 0.089286 | = 750,000/8,400,000 | 0.080645 | ||
| Operational partial productivity | |||||
| Materials | 0.83333 | = 750,000/900,000 | 0.952381 | ||
| Labor | 5.00000 | = 750,000/150,000 | 5.000000 | ||
| Current Output at prior year productivity | |||||
| Materials | 787,500.00 | = 750,000/.952381 | |||
| Labor | 150,000.00 | = 750,000/5.0 |
4.
Mention that any further insight into the relative productivity for either 2015 or 2016 will be generated by the detailed information provided by separating the change in the partial financial productivity rate.
4.
Explanation of Solution
Productivity is the ratio between output and input. It is an indicator of the output produced per unit or per input dollar. It describes different measures of productive efficiency. Therefore, productivity improves when partial productivity increases. Both the input (denominator) and the output (numerator) may be in unit or dollar amount. Calculating productivity primarily aims at improving operation. Enhancements to high- value - added activities reduce the activity costs and/or enhance output value. Low-value - added activities should be eradicated rather than improved. Financial productivity evaluates the output-to-cost relationship of one or more input resources. It is an indicator of the output unit or the output sales values of one or more resources produced per dollar. Partial productivity indices are as many as there are production factors. The most important and frequently used are the partial indices of labor and capital productivity. The partial productivity measures are measures of the nominal price value, physical measures and measurements of fixed price values. Measuring partial productivity concerns designed to measure solutions that do not satisfy the requirements of total productivity measurement, even so, if it will be feasible as total productivity indicators. Productivity describes different measures of productive efficiency. Therefore, productivity improves when partial productivity increases.
| 2016 | 2015 | ||||
| Units manufactured | 750,000 | 1,000,000 | |||
| Units of CT 140 used | 900,000 | 1,050,000 | |||
| Number of labor hours used | 150,000 | 200,000 | |||
| Cost of CT140 per unit | $156 | $135 | |||
| Direct labor wage rate/hr | $56 | $62 | |||
| Total materials cost | $ 140,400,000 | = 900,000 × $156 | $141,750,000 | ||
| Total labor cost | $ 8,400,000 | = 150,000 × $56 | $ 12,400,000 | ||
| Total materials and labor cost | $ 148,800,000 | $154,150,000 | |||
| Financial partial productivity | |||||
| Materials | 0.005342 | = 750,000/140,400,000 | 0.007055 | ||
| Labor | 0.089286 | = 750,000/8,400,000 | 0.080645 | ||
| Operational partial productivity | |||||
| Materials | 0.83333 | = 750,000/900,000 | 0.952381 | ||
| Labor | 5.00000 | = 750,000/150,000 | 5.000000 | ||
| Current Output at prior year productivity | |||||
| Materials | 787,500.00 | = 750,000/.952381 | |||
| Labor | 150,000.00 | = 750,000/5.0 |

The decomposition indicates that changes in financial efficiency from 2015 to 2016 can be due to unfavorable efficiency and price variance of direct materials, partially offset by favorable cost variance for direct labor.
Want to see more full solutions like this?
Chapter 16 Solutions
Cost Management: A Strategic Emphasis

- I want to this question answer for General accounting question not need ai solutionarrow_forwardVincent Company's cost of goods sold is $640,000 variable and $510,000 fixed. The company's selling and administrative expenses are $420,000 variable and $630,000 fixed. If the company's sales is $2,350,000, what is its net income/loss?arrow_forwardDakota Manufacturing uses a standard cost system in which manufacturing overhead is applied to units of product on the basis of standard machine hours. During April, the company used a denominator activity of 40,000 machine hours in computing its predetermined overhead rate. However, 52,000 standard machine hours were allowed for the month's actual production. If the fixed manufacturing overhead volume variance for April was $9,000 unfavorable, then the total budgeted fixed manufacturing overhead cost for the month was $_.arrow_forward
- Whitney manufacturing produces die-cast metal tsve cars for toy shops.arrow_forwardBentley Industries applies manufacturing overhead on the basis of direct labor hours. At the beginning of the most recent year, the company based its predetermined overhead rate on a total estimated overhead of $127,500 and 5,100 estimated direct labor hours. Actual manufacturing overhead for the year amounted to $131,200 and actual direct labor hours were 4,800. The applied manufacturing overhead for the year was closest to __. Helparrow_forwardHello tutor please given General accounting question answer do fast and properly explain all answerarrow_forward
- Please provide the accurate answer to this general accounting problem using valid techniques.arrow_forwardGiven the following information how much raw material was transferred to work in progress on March 31? Inventory on March 1 is $420,000, raw materials purchased in March are $735,000, and raw materials inventory on March 31 is $185,000. A: $890,000 B: $970,000 C: $780,000 D: $955,000arrow_forwardI am trying to find the accurate solution to this general accounting problem with the correct explanation.arrow_forward

 AccountingAccountingISBN:9781337272094Author:WARREN, Carl S., Reeve, James M., Duchac, Jonathan E.Publisher:Cengage Learning,
 Accounting Information SystemsAccountingISBN:9781337619202Author:Hall, James A.Publisher:Cengage Learning,
 Horngren's Cost Accounting: A Managerial Emphasis...AccountingISBN:9780134475585Author:Srikant M. Datar, Madhav V. RajanPublisher:PEARSON
 Intermediate AccountingAccountingISBN:9781259722660Author:J. David Spiceland, Mark W. Nelson, Wayne M ThomasPublisher:McGraw-Hill Education
 Financial and Managerial AccountingAccountingISBN:9781259726705Author:John J Wild, Ken W. Shaw, Barbara Chiappetta Fundamental Accounting PrinciplesPublisher:McGraw-Hill Education